MaxRange
Download script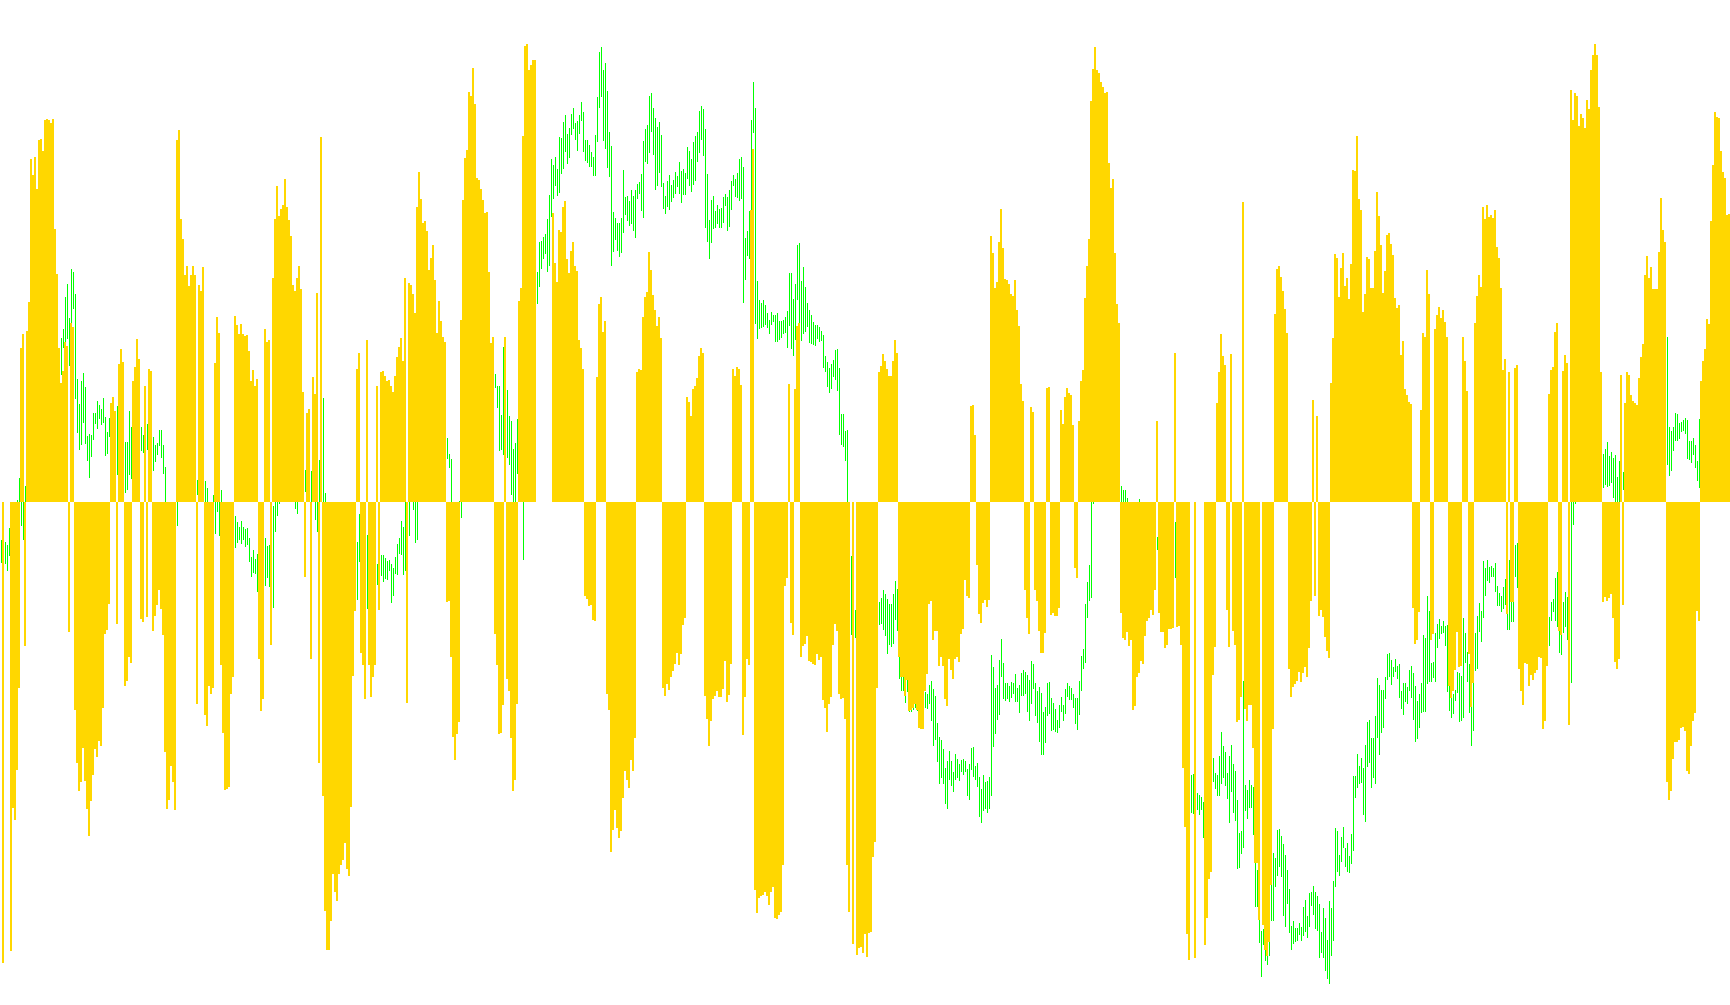
This tool is designed to analyze price action by measuring the volatility and range of movement over a specific historical period. It identifies the extremes (highest highs and lowest lows) within a window of bars you define, then visualizes these movements in a dedicated histogram window.
Core Logic and Functionality
Range Measurement The script looks back at a user-defined number of bars (for example, the last 15 bars). For every point in time, it calculates two primary values:
- Maximum Upward Range: The distance between a high price point and the lowest low found within that lookback period.
- Minimum Downward Range: The distance between a low price point and the highest high found within that lookback period.
The tool automatically prioritizes which of these two values to display based on which one represents a larger absolute move, unless the user chooses to restrict the view to only "Maximums" or only "Minimums."
Visual Coding (Color Logic) The histogram uses a color-coded system to help you instantly distinguish between different levels of price intensity:
- Red Bars: These represent relatively small movements. If the calculated range stays below your designated "Green Limit," the bar appears in red. This signifies low volatility or consolidation.
- Light Green Bars: These appear when the movement exceeds the base limit but remains within a secondary buffer (the "Offset"). This represents a moderate increase in activity.
- Lime Green Bars: These are triggered when the price movement is significantly large, exceeding both the initial limit and the offset. This highlights high-volatility events or significant breakouts.
Key Customizations
The logic allows for high flexibility through several adjustable parameters:
- Lookback Window: You can define exactly how many bars back the tool should scan to find its range values.
- Sensitivity Limits: By adjusting the "Green Limit" and the "Offset," you can calibrate the colors to match the specific volatility of different assets (e.g., a Forex pair might require much smaller limits than a volatile Cryptocurrency).
- Data Filtering: You have the option to toggle the logic to show only upward maximums, only downward minimums, or a combination of both based on which move is more significant at that moment.
In summary, this script acts as a visual thermometer for market volatility, translating raw price data into a color-coded histogram that highlights whether the current range of movement is minor, moderate, or extreme relative to your personal settings.
//+------------------------------------------------------------------+
//|                                                     MaxRange.mq4 |
//|                                                           jpkfox |
//|                                                                  |
//| Gives the maximim and minimum values for given number of bars.   |
//| You can set a limit value so that if the (absolute) value is     |
//| below this limit then histogram bars are red, otherwise green.   |
//|                                                                  |
//| GreenLimit:   Limit for green bars in histogram                  |
//| NumbOfBars:   Number of bars starding from the current bar and   |
//|               including the current bar.                         |
//| OnlyMax:      If true, then only maximimum value for the current |
//|               bar is shown.                                      |
//| OnlyMin:      If true, then only minimum value for the current   |
//|               bar is shown.                                      |
//|                                                                  |
//|                                                                  |
//|                                                                  |
//+------------------------------------------------------------------+
#property  copyright "jpkfox"
//---- indicator settings
#property  indicator_separate_window
#property  indicator_buffers 3
#property  indicator_color1  FireBrick
#property  indicator_color2  LightGreen
#property  indicator_color3  LimeGreen
//---- indicator parameters
extern int GreenLimit=75;             // limit for green bars in histogram
extern int DarkGreenLimitOffset=30;   // Offsetlimit from GreenLimit for darkgreen bars in histogram
                                      // If GreenLimit = 75 and DarkGreenLimitOffset = 20
                                      // then DarkGreenLimit = 95. If <= 0 then not in use.
extern int NumbOfBars=15;             // including the current bar PaleGreen  LimeGreen
extern bool OnlyMax=false;
extern bool OnlyMin=false;
//---- indicator buffers
double RedBuffer[];
double GreenBuffer[];
double GreenBuffer2[];
//+------------------------------------------------------------------+
//| Custom indicator initialization function                         |
//+------------------------------------------------------------------+
int init()
  {
//---- 2 additional buffers are used for counting.
   IndicatorBuffers(3);
//---- drawing settings
   SetIndexStyle(0,DRAW_HISTOGRAM,STYLE_SOLID,2);
   SetIndexStyle(1,DRAW_HISTOGRAM,STYLE_SOLID,2);
   SetIndexStyle(2,DRAW_HISTOGRAM,STYLE_SOLID,2);
   IndicatorDigits(0);
   //   IndicatorDigits(MarketInfo(Symbol(),MODE_DIGITS)+2);
//---- 3 indicator buffers mapping
   if(!SetIndexBuffer(0,RedBuffer) &&
      !SetIndexBuffer(1,GreenBuffer) &&
      !SetIndexBuffer(2,GreenBuffer2))
      Print("cannot set indicator buffers!");
//---- name for DataWindow and indicator subwindow label
   if(OnlyMax)
      IndicatorShortName("MaxRange("+NumbOfBars+","+GreenLimit + ", OnlyMax)");
   else if(OnlyMin)
         IndicatorShortName("MaxRange("+NumbOfBars+","+GreenLimit + ", OnlyMin)");
      else
         IndicatorShortName("MaxRange("+NumbOfBars+","+GreenLimit + ")");
//---- initialization done
   return(0);
  }
//+------------------------------------------------------------------+
//| The Range                                                        |
//+------------------------------------------------------------------+
int start()
  {
   int i, j;
   int nLimit, nCountedBars;
   double nMax, nMin, nVal;
   double Multiply;
   int nDarkGreenOffset;
   if(NumbOfBars < 0)
     {
      Print("Error: NumbOfBars < 0");
      NumbOfBars=15;
     }
   nCountedBars=IndicatorCounted();
//---- check for possible errors
   if(nCountedBars<0)
      return(-1);
//---- last counted bar will be recounted
   if(nCountedBars>0)
      nCountedBars--;
   nLimit=Bars-nCountedBars;
   Multiply=MathPow(10,MarketInfo(Symbol(),MODE_DIGITS));
   if(DarkGreenLimitOffset>=0)
      nDarkGreenOffset=DarkGreenLimitOffset;
   else
      nDarkGreenOffset=999999; // infinite
//---- main loop
   for(i=0; i<nLimit; i++)
     {
      nMax=-999999.0;
      nMin=999999.0;
      RedBuffer[i]=0.0;
      GreenBuffer[i]=0.0;
      GreenBuffer2[i]=0.0;
      for(j=i+1; j<i+NumbOfBars; j++)
        {
         // Max up range
         nVal=High[i] - Low[j];
         if(nVal > nMax)
            nMax=nVal;
         // Min down range
         nVal=Low[i] - High[j];
         if(nVal < nMin)
            nMin=nVal;
        }
      if(OnlyMax
      ||(!OnlyMin && (MathAbs(nMax) > MathAbs(nMin)) && (nMax > 0.00) )
      )
        {
         if(10000.0*nMax < GreenLimit)
            RedBuffer[i]=Multiply*nMax;
         else if(10000.0*nMax < (GreenLimit + nDarkGreenOffset))
               GreenBuffer[i]=Multiply*nMax;
            else
               GreenBuffer2[i]=Multiply*nMax;
        }
      else
        {
         if(10000.0*nMin > -GreenLimit)
            RedBuffer[i]=Multiply*nMin;
         else if(10000.0*nMin > (-GreenLimit - nDarkGreenOffset))
               GreenBuffer[i]=Multiply*nMin;
            else
               GreenBuffer2[i]=Multiply*nMin;
        }
     }
   return(0);
  }
//+------------------------------------------------------------------+
Comments