MaxMinBands
Download script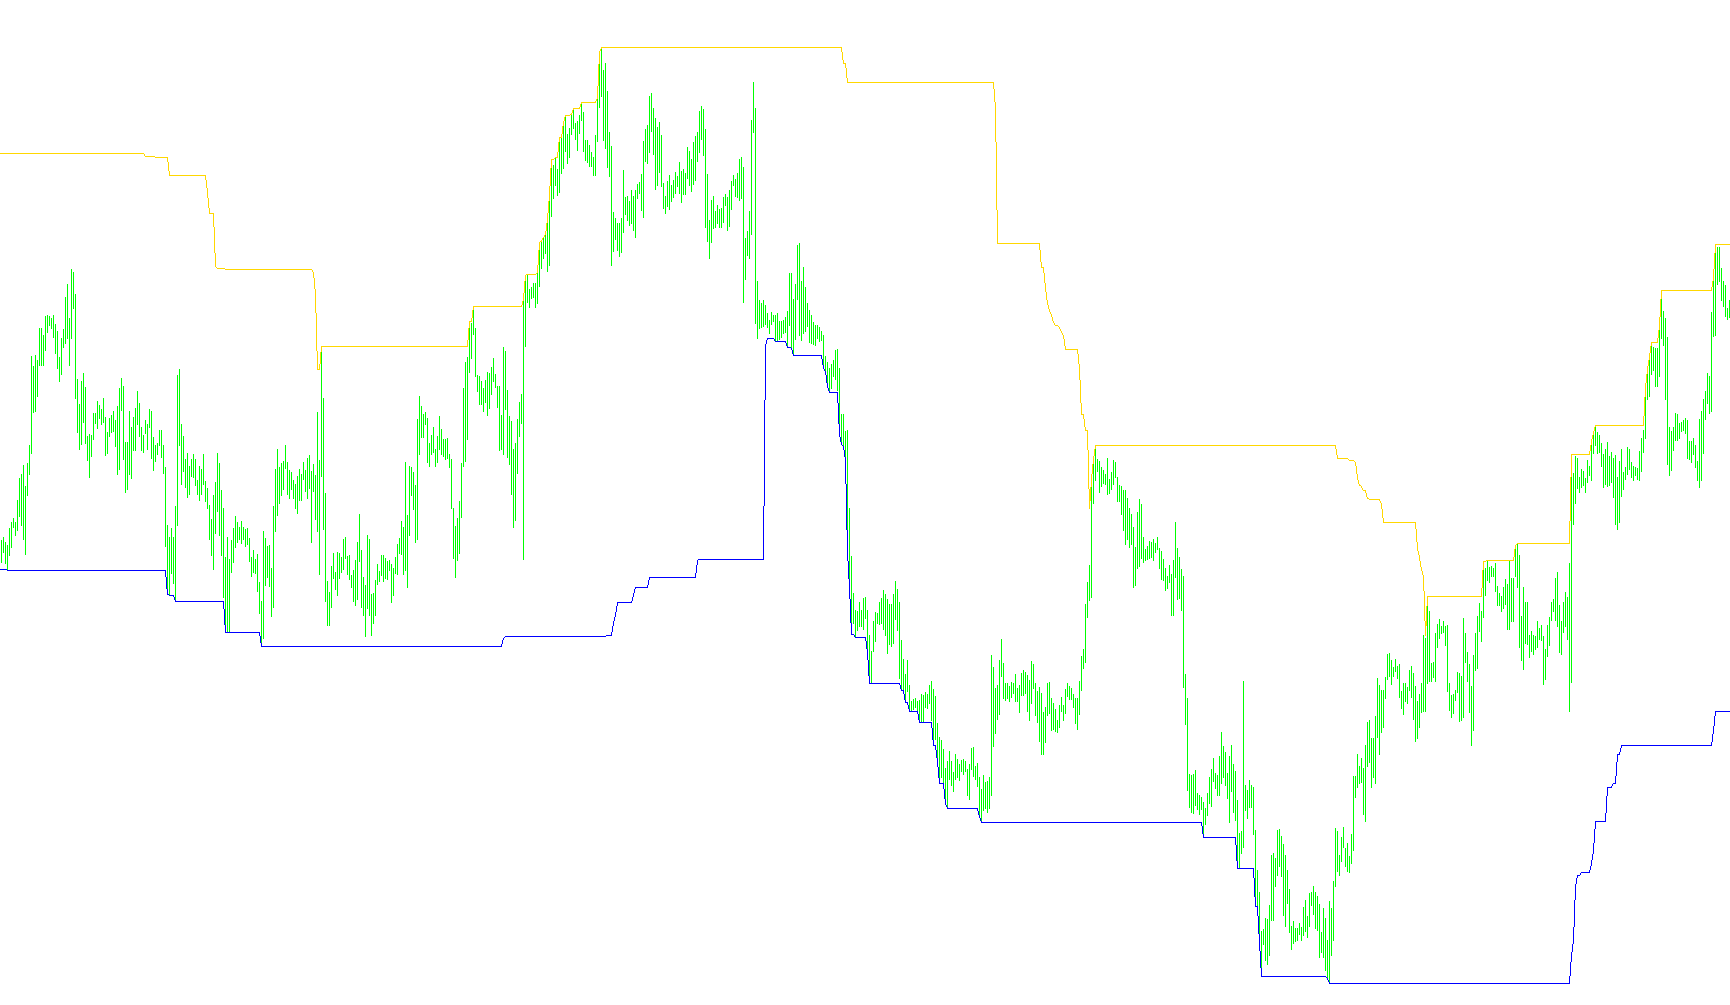
This tool is designed to provide a visual representation of the price extremes over a specific timeframe on your trading chart. Instead of looking at every single price fluctuation, it simplifies the market data by identifying the absolute highest and lowest points reached within a rolling window of time.
How it Works
The script functions by scanning back through history to find two key boundaries:
- The Upper Band: This line represents the "ceiling." It looks back at a set number of previous candles (defined by the user) and identifies the single highest price reached during that entire period. As new candles form, this line updates to reflect the highest point of the most recent window.
- The Lower Band: This line represents the "floor." Similarly, it scans the same timeframe to find the lowest price reached. This creates a visible boundary for the minimum price level in that section of the market.
Key Features and Behavior
- Dynamic Range Visualization: By drawing these two bands on your chart, you can clearly see the "trading range" or the volatility boundaries for a specific period. It helps you distinguish between normal price action within a range and significant breakouts beyond those established highs and lows.
- Customizable Sensitivity: The timeframe over which the script looks (the "Band Period") is fully adjustable. You can set it to a short period to see immediate, fast-moving extremes or a longer period to identify major structural boundaries in the market.
- Real-Time Updates: The logic automatically recalculates with every new price movement, ensuring that the bands move dynamically as the "highest high" or "lowest low" of the specified period changes.
In short, this indicator filters out the "noise" of minor price movements to highlight the true structural limits of the market over your chosen timeframe.
Miscellaneous
11
Views
0
Downloads
0
Favorites
MaxMinBands
//+------------------------------------------------------------------+
//|                                                  MaxMinBands.mq4 |
//|                      Copyright © 2005, MetaQuotes Software Corp. |
//|                                       http://www.metaquotes.net/ |
//+------------------------------------------------------------------+
#property copyright "Copyright © 2009, Julien Loutre"
#property link      "http://www.zenhop.com"
//---- indicator settings
#property  indicator_chart_window
#property indicator_buffers  2
#property  indicator_color1  LightSkyBlue
#property  indicator_color2  Plum

//---- input parameters


extern int       Band_Period   = 120;


//---- buffers
double WWBuffer1[];
double WWBuffer2[];

double ATR;

int init() {
   IndicatorBuffers(2);
//---- drawing settings
   SetIndexStyle(0,DRAW_LINE);
   SetIndexStyle(1,DRAW_LINE);
   IndicatorDigits(Digits+2);

   SetIndexBuffer(0, WWBuffer1);
   SetIndexBuffer(1, WWBuffer2);

   IndicatorShortName("Min/Max Bands");


   return(0);
  }
int start() {
   int    counted_bars=IndicatorCounted();
   int    limit,i;

   if(counted_bars>0) counted_bars--;
   limit=Bars-counted_bars;

   for(i=limit-1; i>=0; i--) {

      WWBuffer1[i] = getPeriodHigh(Band_Period,i);
      WWBuffer2[i] = getPeriodLow(Band_Period,i);


   }
   return(0);
}

double getPeriodHigh(int period, int pos) {
   int i;
   double buffer = 0;
   for (i=pos;i<=pos+period;i++) {
      if (High[i] > buffer) {
         buffer = High[i];
      }
   }
   return (buffer);
}
double getPeriodLow(int period, int pos) {
   int i;
   double buffer = 100000;
   for (i=pos;i<=pos+period;i++) {
      if (Low[i] < buffer) {
         buffer = Low[i];
      }
   }
   return (buffer);
}
Comments