Detailed Professional Description of the MACD MQL Script
This script is designed for use with MetaTrader 4 (MT4), a popular platform for trading Forex, commodities, and CFDs. It implements the Moving Average Convergence Divergence (MACD) indicator, which is widely used in technical analysis to identify potential buy and sell signals based on momentum.
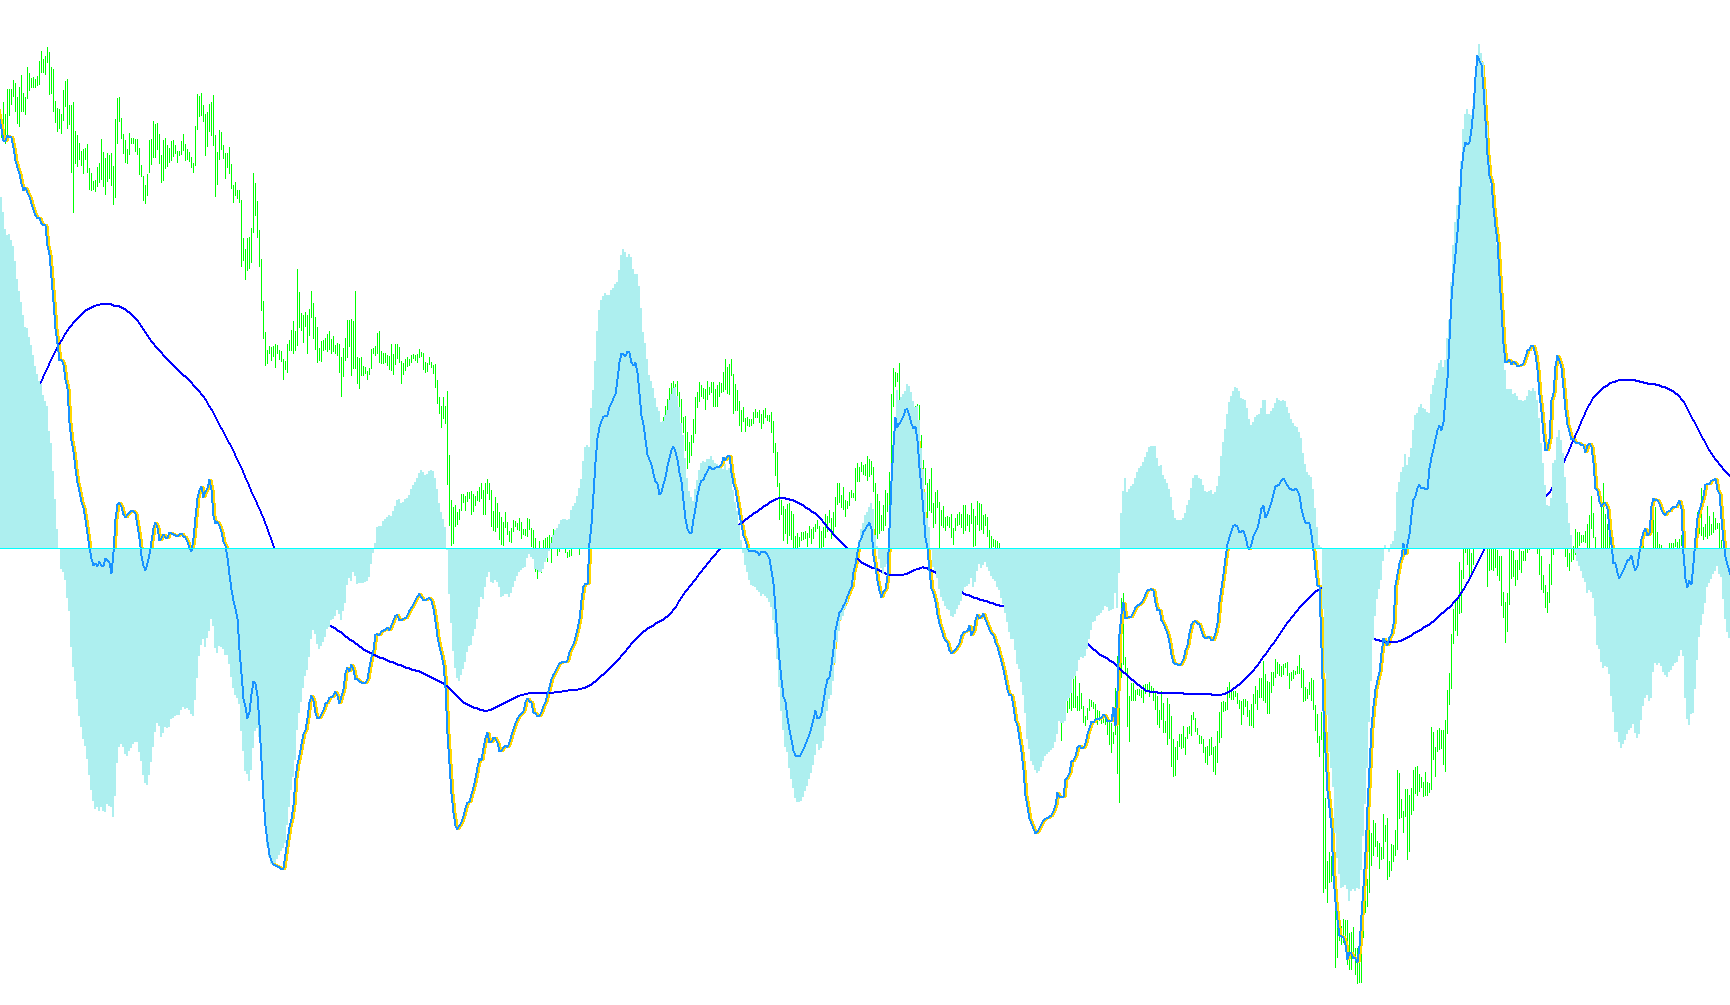
Overview
The script calculates the MACD line, Signal line, Histogram, and additional features such as arrows for trade entries and exits. These components help traders visualize market trends and make informed trading decisions.
Key Components
-
MACD Line:
- Calculated as the difference between a fast Exponential Moving Average (EMA) and a slow EMA.
- Represents the momentum of the price movement.
-
Signal Line:
- A Simple Moving Average (SMA) of the MACD line.
- Used to generate trading signals when it crosses above or below the MACD line.
-
Histogram:
- The difference between the MACD line and the Signal line.
- Indicates the strength of the momentum.
-
Zero Line:
- A reference line at zero, helping traders identify overbought or oversold conditions.
-
Arrows for Trade Entries/Exits:
- Visual indicators to suggest potential trade opportunities.
- Arrows are plotted based on specific conditions involving the Histogram values and thresholds.
Parameters
- FastEMA: The period for the fast EMA (default is 9).
- SlowEMA: The period for the slow EMA (default is 64).
- SignalSMA: The period for the Signal line SMA (default is 112).
- HistThreshold: A threshold value used to determine significant changes in the Histogram.
Logic and Functionality
-
Initialization:
- Sets up the indicator styles, buffers, and labels.
- Ensures that all previous objects are deleted before new ones are created.
-
Calculation of Indicators:
- The MACD line is calculated using the fast and slow EMAs.
- The Signal line is derived from the MACD line using an SMA.
- The Histogram shows the difference between the MACD and Signal lines, providing insight into momentum strength.
- The script also calculates a previous period's MACD value for additional analysis.
-
Arrow Plotting:
- Arrows are plotted to indicate potential trade entries or exits.
- Conditions for plotting arrows include changes in the Histogram values relative to the threshold and transitions between positive and negative values.
- Different colored arrows represent different types of trades (e.g., long, short).
-
Trade Signals:
- The script identifies potential buy signals when the Histogram crosses from below zero to above, indicating increasing momentum.
- Sell signals are identified when the Histogram crosses from above zero to below, suggesting decreasing momentum.
-
Dynamic Updates:
- The script dynamically updates the indicators and arrows as new market data becomes available, ensuring traders have up-to-date information.
Conclusion
This MACD MQL script provides a comprehensive tool for technical analysis in MT4. By visualizing key indicators and offering trade entry/exit signals through arrows, it aids traders in making informed decisions based on market momentum. The flexibility of adjustable parameters allows users to tailor the indicator to their specific trading strategies.
/////////////////////////////////////////////////////////////////////////////////////////////
//| mymacd v2 12/11/05
/////////////////////////////////////////////////////////////////////////////////////////////
#property link "jpygbp@yahoo.com"
#property indicator_buffers 5
#property indicator_separate_window
#property indicator_color1 HotPink    //macd
#property indicator_color2 Lime     //signal
#property indicator_color3 Gray  //histogram
#property indicator_color4 Blue  //macd[1]
#property indicator_color5 Black     //zero line
//---- buffers
double Buffer1[]; //macd
double Buffer2[]; //signal
double Buffer3[]; //histogram
double Buffer4[]; //macd[1]
double Buffer5[]; //zero line
//
extern int FastEMA = 9;
extern int SlowEMA = 64;
extern int SignalSMA = 112;
//extern bool plotMACD = true;
//extern bool plotSignalLine = true;
//extern bool plotHistogram = true;
//extern bool plotMACDOneBarAgo = true;
//extern bool plotZeroLine = true;
extern bool plotArrows = false;
extern double HistThreshold = 0;
//
//
int limit = 0;
int fontsize=10;
int i = 0;
bool InLTrade = false;
bool InSTrade = false;
/////////////////////////////////////////////////////////////////////////////////////////////
int init()
{
   ObjectsDeleteAll();
   //---- indicators
   SetIndexStyle(0,DRAW_LINE,STYLE_SOLID,2);//macd
   SetIndexStyle(1,DRAW_LINE,STYLE_SOLID,2);//signal
   SetIndexStyle(2,DRAW_HISTOGRAM,STYLE_SOLID,2);//hist
   SetIndexStyle(3,DRAW_LINE,STYLE_SOLID,2);//macd[1]
   SetIndexStyle(4,DRAW_LINE,STYLE_SOLID,1);//zero
   //
   SetIndexBuffer(0,Buffer1);
   SetIndexBuffer(1,Buffer2);
   SetIndexBuffer(2,Buffer3);
   SetIndexBuffer(3,Buffer4);
   SetIndexBuffer(4,Buffer5);
   //
   SetIndexDrawBegin(1,SignalSMA);
   //
   IndicatorDigits(MarketInfo(Symbol(),MODE_DIGITS)+1);
   //
   IndicatorShortName("MACD("+FastEMA+","+SlowEMA+","+SignalSMA+")");
   //
   SetIndexLabel(0,"MACD");
   SetIndexLabel(1,"Signal");
   SetIndexLabel(2,"Histogram");
   SetIndexLabel(3,"MACD[1]");
   SetIndexLabel(4,"Zero");
   //
   return(0);
}
/////////////////////////////////////////////////////////////////////////////////////////////
string NewArrow(datetime T1, double P1, color collor)
{
   string N=StringConcatenate("A",collor,"-",TimeToStr(T1));
   int AC=SYMBOL_STOPSIGN;
   if(collor==Blue)
      AC=SYMBOL_ARROWUP;
   if(collor==Red)
      AC=SYMBOL_ARROWDOWN;
   //
   ObjectCreate(N, OBJ_ARROW, 0, T1, P1);
   ObjectSet(N, OBJPROP_ARROWCODE, AC);
   ObjectSet(N, OBJPROP_COLOR, collor);
   ObjectSet(N, OBJPROP_WIDTH, 1);
   ObjectsRedraw();
   return(N);
}
/////////////////////////////////////////////////////////////////////////////////////////////
int deinit()
{
   ObjectsRedraw();
   return(0);
}
/////////////////////////////////////////////////////////////////////////////////////////////
int start()
{
   int counted_bars=IndicatorCounted();
   if(counted_bars<0) return(-1);//---- check for possible errors
   if(counted_bars>0) counted_bars--;//---- last counted bar will be recounted
   limit=Bars-counted_bars;
   //
   for(i=0; i<limit; i++)//---- macd counted in the 1-st buffer histogram
      Buffer1[i]=iMA(NULL,0,FastEMA,0,MODE_EMA,PRICE_CLOSE,i)-iMA(NULL,0,SlowEMA,0,MODE_EMA,PRICE_CLOSE,i);
   //
   for(i=0; i<limit; i++)//---- signal line counted in the 2-nd buffer line
      Buffer2[i]=iMAOnArray(Buffer1,Bars,SignalSMA,0,MODE_SMA,i);
   //
   for(i=0; i<limit; i++)//---- histogram is the difference between macd and signal line
   {
      Buffer3[i]=Buffer1[i]-Buffer2[i];
      Buffer5[i]=0;
   }
   //
   for(i=1; i<limit; i++)//---- macd[1]
      Buffer4[i]=iMA(NULL,0,FastEMA,0,MODE_EMA,PRICE_CLOSE,i-1)-iMA(NULL,0,SlowEMA,0,MODE_EMA,PRICE_CLOSE,i-1);
   //
   if (plotArrows)
   {
      ObjectsDeleteAll();
      InLTrade = false;
      InSTrade = false;
      for(int i=Bars;i>=0;i--)
      {
         if ((Buffer3[i-1]  > 0) && (Buffer3[i] < 0) && Buffer3[i-1] > HistThreshold)//Long Begin
         {
           string upArrow1=NewArrow(Time[i-1], High[i-1]+0.0005, Blue);
            InLTrade = true;
         }
         if ((Buffer3[i-1]  < 0) && (Buffer3[i] > 0) && Buffer3[i-1] < -HistThreshold)//Short Begin
         {
            string dnArrow1=NewArrow(Time[i-1], Low[i-1]-0.0003, Red);
            InSTrade = true;
            InLTrade = false;
         }
         if ((InSTrade  == true) && (Buffer3[i-1] > Buffer3[i]))//Short End
         {
            string upArrow2=NewArrow(Time[i-1], Low[i-1]-0.0003, Aqua);
            InSTrade = false;
         }
         if ((InLTrade == true) && (Buffer3[i-1] < Buffer3[i]))//Long End
         {
            string dnArrow2=NewArrow(Time[i-1], High[i-1]+0.0005, Aqua);
            InLTrade = false;
         }
      }
   }
   //
   //
   return(0);
}
/////////////////////////////////////////////////////////////////////////////////////////////
Comments