ma_i_EF_distance
Download script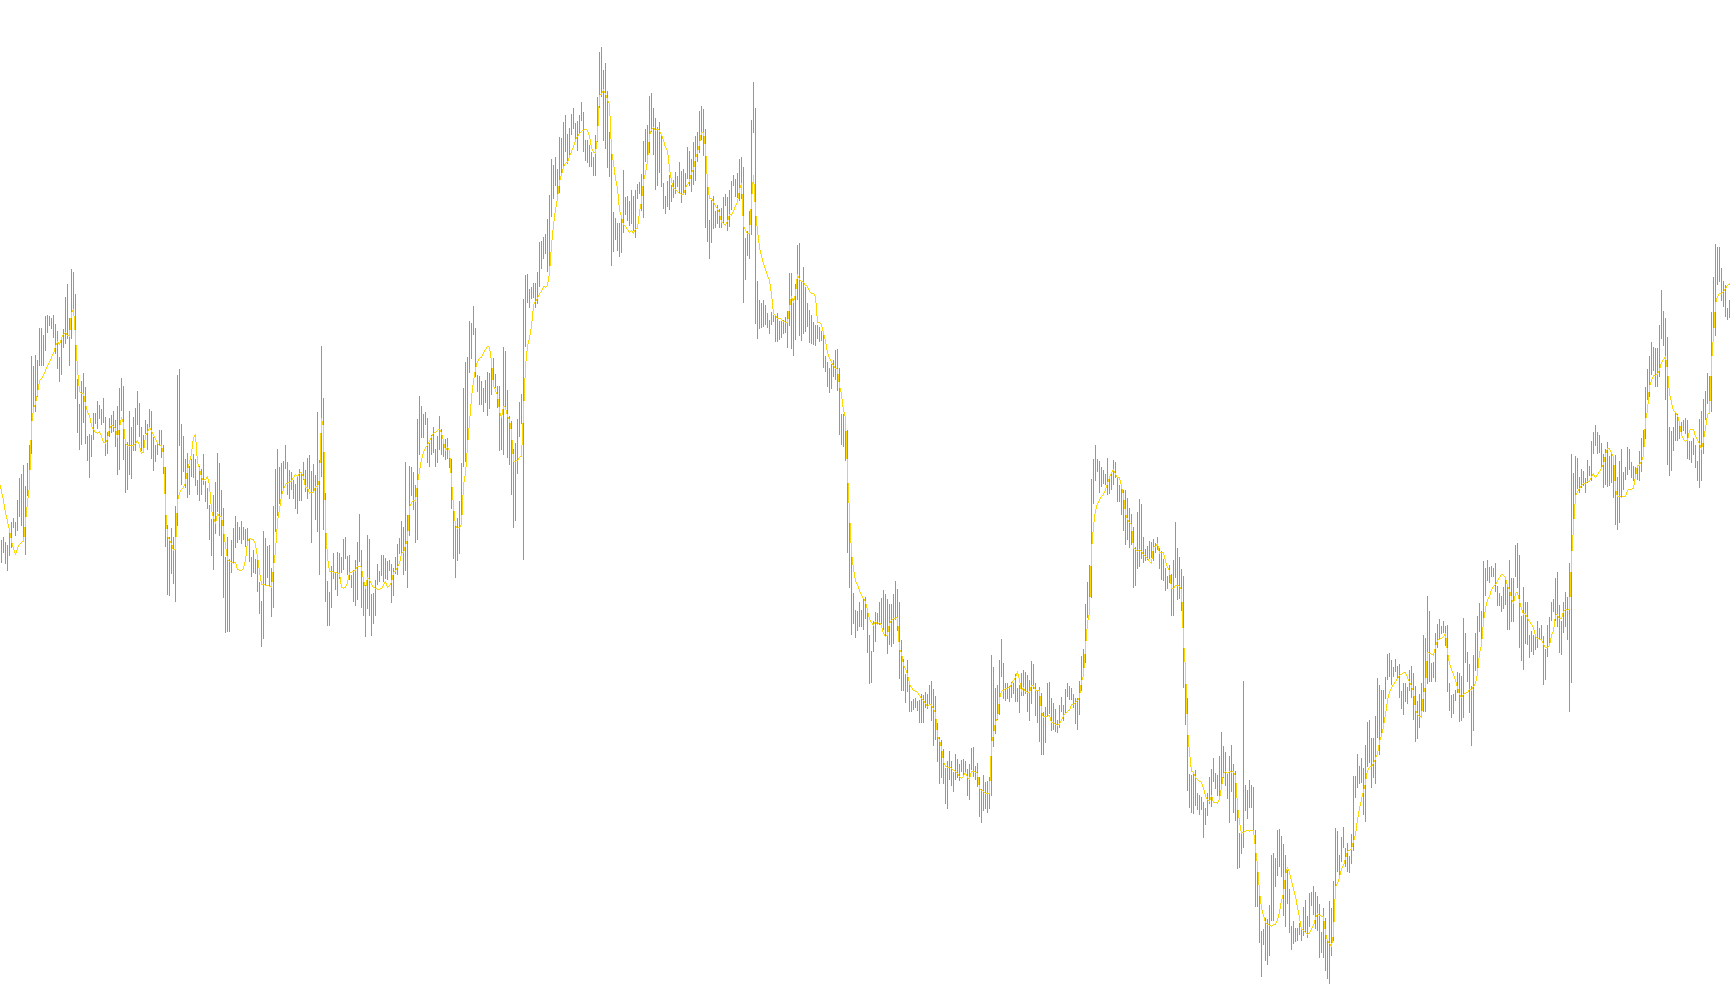
This tool is designed to provide a smoothed visualization of market price action by calculating a weighted average based on relative distance. Instead of simply looking at the current price, the script analyzes how far the current price has moved away from previous prices over a specific period.
Core Logic Overview
The primary objective of this script is to identify the "center of gravity" for price within a set timeframe. It achieves this by performing three main steps:
1. Calculating Price Variance (Distance) The script looks back at a user-defined number of candles (the "Length"). For each point in time, it calculates the absolute difference between the current closing price and the closing prices of the preceding candles. By applying a "Power" factor to these differences, the script can be adjusted to give more weight to larger price swings, making the resulting data more sensitive to significant volatility or more stable during quiet periods.
2. Weighting the Data Rather than treating every historical candle as equally important, the logic creates a weighted value for each period. It sums up these distance calculations to create a "norm" (a baseline of total movement). This ensures that the importance of any single price point is relative to the overall volatility occurring during that specific window of time.
3. Generating the Smoothed Line Finally, the script produces a weighted average. It takes the closing prices of the recent candles and multiplies them by their respective distance weights. By dividing this total by the baseline movement (the "norm"), it produces a single, smoothed value for every point on the chart.
Practical Effect
The resulting visual output acts as a stabilized trend line. Because it uses weighted distances rather than a simple moving average, it is designed to react dynamically to the intensity of price movements. It essentially filters out "noise" by centering the line based on where the price has spent the most significant energy relative to its recent history.
//+------------------------------------------------------------------+
//|                                               _i_EF_distance.mq4 |
//|                                     Copyright © 2006, Doji Starr |
//|                                                                  |
//+------------------------------------------------------------------+
#property copyright "Copyright © 2006, Doji Starr"
#property indicator_chart_window
#property indicator_buffers 1
#property indicator_color1 Aqua
// input params
extern int Length=10;
extern double Power=2;
// vars
int i, c, startBar;
double coef, norm;
// buffers
double buf_el[], buf_co[];
//+------------------------------------------------------------------+
//| Custom indicator initialization function                         |
//+------------------------------------------------------------------+
int init()
  {
   IndicatorBuffers(2);
   SetIndexBuffer(0,buf_el);
   SetIndexStyle(0,DRAW_LINE);
   SetIndexBuffer(1,buf_co);
   return(0);
  }
//+------------------------------------------------------------------+
//| Custom indicator deinitialization function                       |
//+------------------------------------------------------------------+
int deinit()
  {
   return(0);
  }
//+------------------------------------------------------------------+
//| Custom indicator iteration function                              |
//+------------------------------------------------------------------+
int start()
  {
   if (Bars<=Length)
      return(0);
//----
   int bar;
   int counted_bars=IndicatorCounted();
   if (counted_bars < 1)
     {
      // filling initial values in buffers
      for(bar=Bars-1; bar>=Bars-Length*2; bar--)
        {
         buf_el[bar]=Close[bar];
         buf_co[bar]=0.0;
        }
      startBar=Bars-Length*2-1;
     }
   else
      startBar=Bars-counted_bars-1;
   for(bar=startBar; bar>=0; bar--)
     {
      buf_co[bar]=0.0;
      for(i=Length-1; i>=0; i--)
         buf_co[bar]+=MathAbs(MathPow(Close[bar]-Close[bar+i], Power));
//----
      norm=0.0;
      buf_el[bar]=0.0;
      for(i=Length-1; i>=0; i--)
        {
         norm+=buf_co[bar+i];
         buf_el[bar]+=buf_co[bar+i] * Close[bar+i];
        }
      if (norm!=0)
         buf_el[bar]/=norm;
      else
         buf_el[bar]=0.0;
      //Print(norm);
     }
//----
   return(0);
  }

//+------------------------------------------------------------------+
Comments