Lsma-2
Download script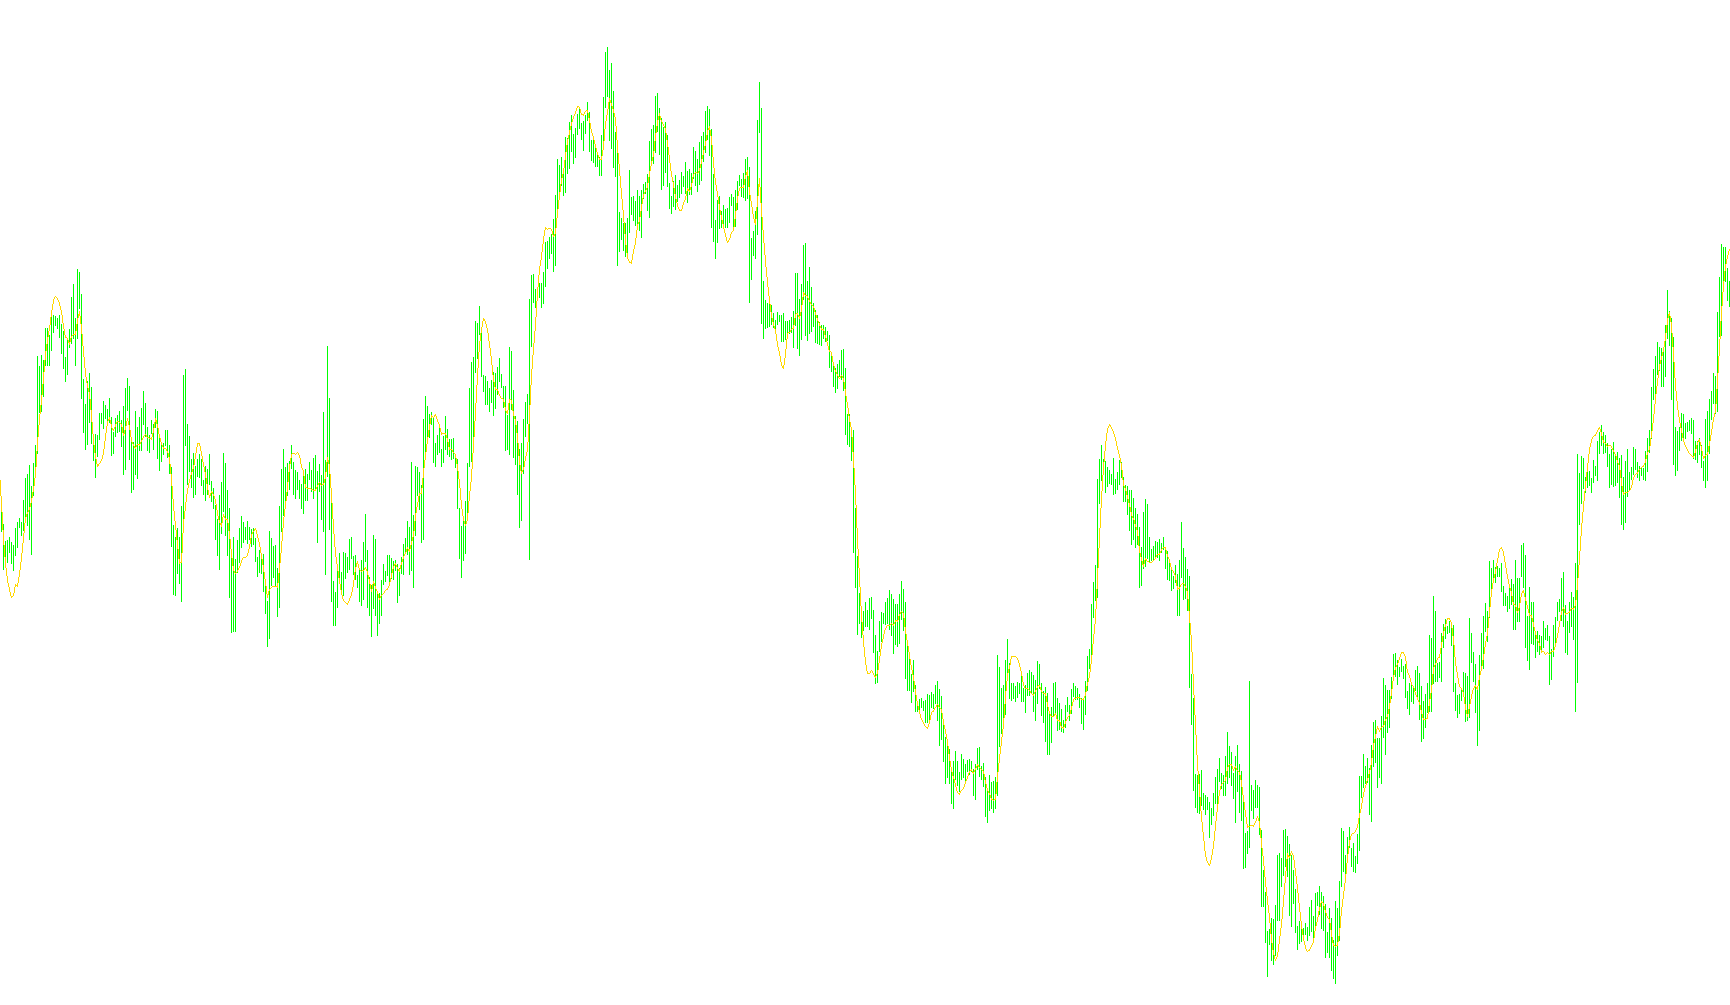
The Linear Statistical Model Average (LSMA) is a sophisticated technical analysis tool designed to provide traders with a smoothed view of price action by identifying the underlying trend of a market. Unlike standard moving averages that simply calculate the mean of past prices, this script utilizes "linear regression" logic to project where the price is headed based on its recent trajectory.
Core Functionality
The primary objective of this script is to plot a single, continuous line on your trading chart. This line represents the "best fit" for the current price movement over a specific timeframe. By calculating a regression line—similar to how a mathematician might draw a straight line through a scatter plot of data points—the tool helps traders filter out market "noise" and identify the primary direction of the trend.
Key Features and Customization
The script offers several layers of flexibility to ensure it aligns with specific trading styles:
- Time Period Adjustment: You can define the look-back period (the number of bars used for the calculation). A shorter period makes the line more responsive to immediate price changes, while a longer period provides a smoother, broader view of the long-term trend.
- Price Source Selection: The logic allows you to choose which specific price data points the indicator should monitor. Users can select from various types, including:
- Standard prices like Open, High, Low, or Close.
- Derived averages such as the Median (average of High and Low), Typical (average of High, Low, and Close), or Weighted price calculations.
- Mathematical Weighting: The underlying calculation applies a specific weight to different points in the look-back period. This ensures that the final value is mathematically balanced, providing a more accurate representation of the "endpoint" of the linear regression than a simple average would offer.
How to Interpret the Logic
When viewing the line on a chart, the LSMA acts as a trend guide. Because it is based on regression, it reacts to the momentum of the price. If the line is sloping upward, it confirms a bullish trend; if it is sloping downward, it indicates a bearish trend. By choosing different price types and periods, traders can calibrate the tool to be either a "fast" indicator for quick entries or a "slow" indicator for identifying major structural shifts in the market.
//+------------------------------------------------------------------+
//|                                                   Lsma.mq4       |
//|                                    Copyright © 2004, Robert Hill |
//|                                             http://www.fxdd.com/ |
//|                                                                  |
//| LSMA displays a line using the endpoint of                       |
//| the linear regression line                                       |
//+------------------------------------------------------------------+
#property  copyright "Copyright © 2004, Robert Hill"
#property  link      "http://www.fxdd.com/"

//---- indicator settings
#property  indicator_chart_window
#property  indicator_buffers 1
#property indicator_color1 Yellow
#property indicator_width1 2

extern int LSMA_Period = 14;
extern string  p = "--Applied Price Types--";
extern string  p0 = " 0 = close";
extern string  p1 = " 1 = open";
extern string  p2 = " 2 = high";
extern string  p3 = " 3 = low";
extern string  p4 = " 4 = median(high+low)/2";
extern string  p5 = " 5 = typical(high+low+close)/3";
extern string  p6 = " 6 = weighted(high+low+close+close)/4";
extern int     LSMA_AppliedPrice = 0;//0=close, 1=open, 2=high, 3=low, 4=median(high+low)/2, 5=typical(high+low+close)/3, 6=weighted(high+low+close+close)/4

//---- buffers
double LSMA_Buffer[];

//+------------------------------------------------------------------+
//| Custom indicator initialization function                         |
//+------------------------------------------------------------------+
int init()
  {

//---- drawing settings
   SetIndexBuffer(0,LSMA_Buffer);

   SetIndexStyle(0,DRAW_LINE,STYLE_SOLID);
   SetIndexLabel(0, "Lsma");
	IndicatorShortName("LSMA("+LSMA_Period+")");

//---- initialization done
   return(0);
  }

int start()

  {
   int    i, limit;
   int    counted_bars=IndicatorCounted();
   if(counted_bars>0) counted_bars--;
   limit=Bars-counted_bars;

   for(i = limit; i >= 0; i--)
        LSMA_Buffer[i] = LSMA(LSMA_Period, LSMA_AppliedPrice, i);

      return(0);
  }

//+------------------------------------------------------------------+
//| LSMA with PriceMode                                              |
//| PrMode  0=close, 1=open, 2=high, 3=low, 4=median(high+low)/2,    |
//| 5=typical(high+low+close)/3, 6=weighted(high+low+close+close)/4  |
//+------------------------------------------------------------------+

double LSMA(int Rperiod, int prMode, int shift)
{
   int i;
   double sum, pr;
   int length;
   double lengthvar;
   double tmp;
   double wt;

   length = Rperiod;

   sum = 0;
   for(i = length; i >= 1  ; i--)
   {
     lengthvar = length + 1;
     lengthvar /= 3;
     tmp = 0;
     switch (prMode)
     {
     case 0: pr = Close[length-i+shift];break;
     case 1: pr = Open[length-i+shift];break;
     case 2: pr = High[length-i+shift];break;
     case 3: pr = Low[length-i+shift];break;
     case 4: pr = (High[length-i+shift] + Low[length-i+shift])/2;break;
     case 5: pr = (High[length-i+shift] + Low[length-i+shift] + Close[length-i+shift])/3;break;
     case 6: pr = (High[length-i+shift] + Low[length-i+shift] + Close[length-i+shift] + Close[length-i+shift])/4;break;
     }
     tmp = ( i - lengthvar)*pr;
     sum+=tmp;
    }
    wt = NormalizeDouble((sum*6)/(length*(length+1)),Digits);

    return(wt);
}

//+------------------------------------------------------------------+
Comments