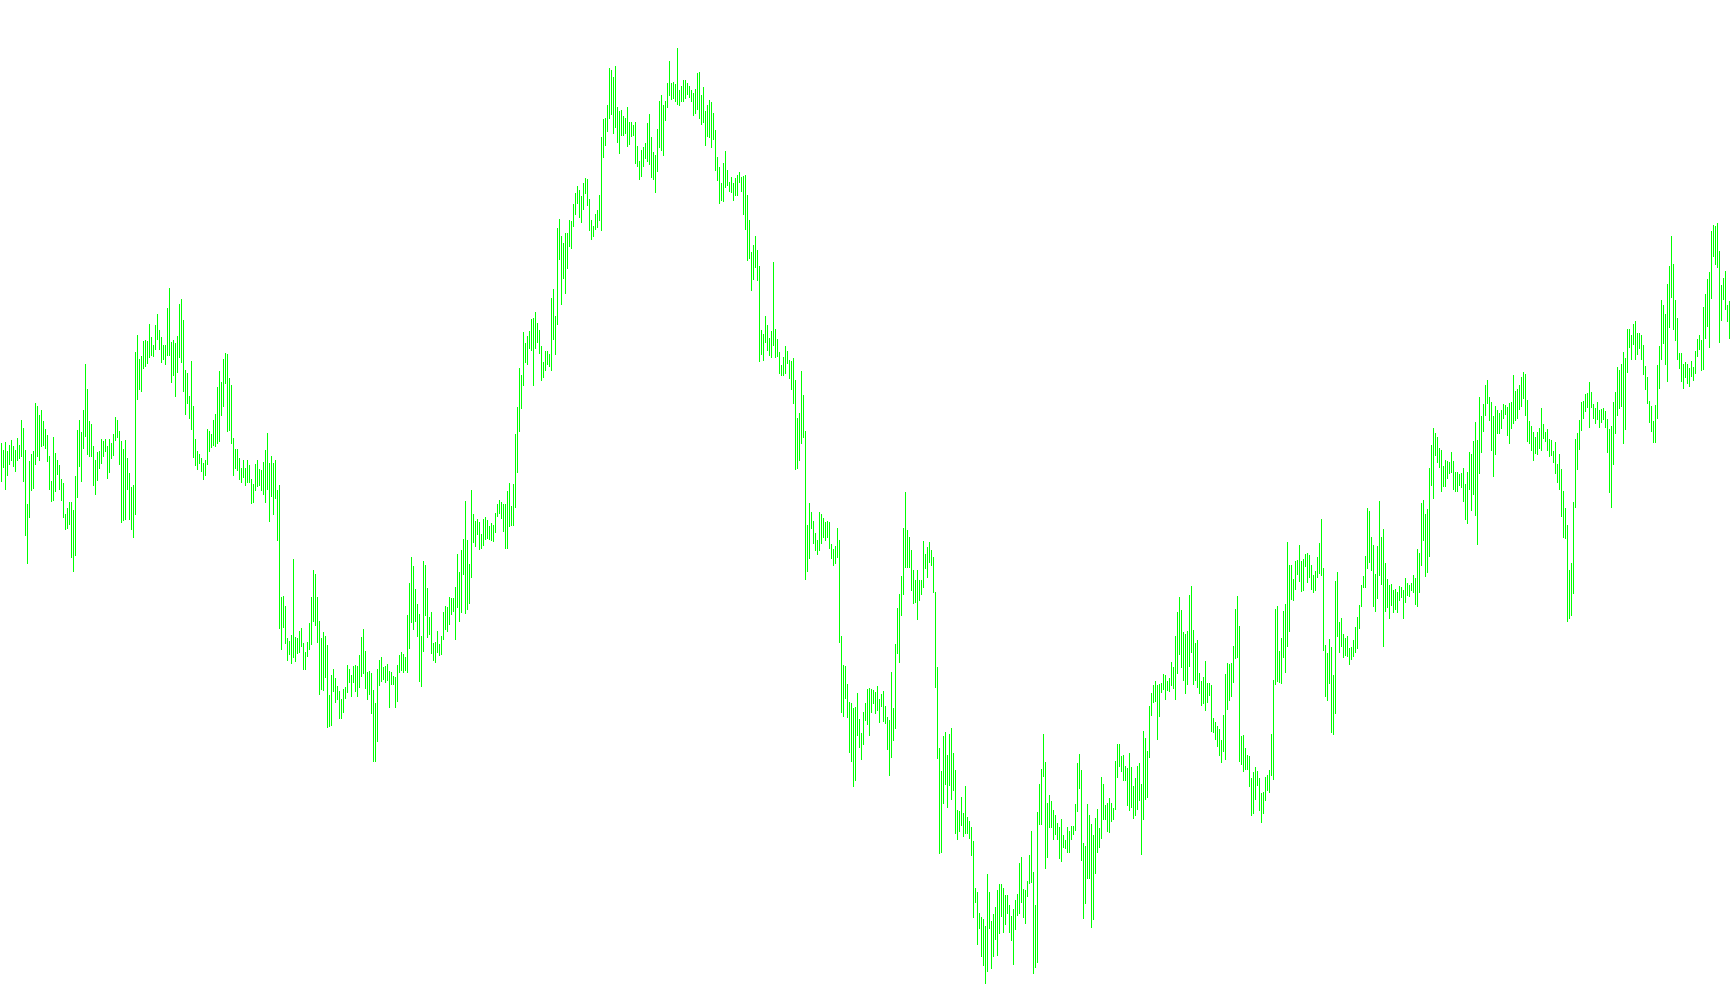
This tool is designed to provide a visual representation of price trends on your trading chart by using a mathematical method called Linear Regression. Instead of just looking at where the price is currently sitting, this script analyzes a specific window of historical data to determine the "line of best fit."
Core Logic and Functionality
The script works by looking back at a set number of previous bars (determined by the period setting) to identify the underlying direction of the market. Here is how it processes that information:
- Data Collection: For every point on your chart, the tool looks at the closing prices over a specific timeframe.
- Trend Calculation: It calculates two primary mathematical components:
- The Slope: This identifies the angle and direction of the price movement (whether it is moving up, down, or staying flat).
- The Intercept: This establishes the starting point of that trend within the timeframe.
- Best Fit Projection: By combining the slope and the intercept, the tool calculates a single value that represents where the price "should" be based on its recent momentum.
Visual Output
Rather than cluttering your screen with every minor price fluctuation, this script smooths out the "noise" of the market. It plots a continuous blue line that follows the overall trajectory of the price.
When you see the line moving upward, it indicates a statistically consistent bullish trend over the chosen period. Conversely, a downward slope suggests a bearish trend. Because it uses linear regression, the line acts as a smoothed path, helping traders visualize the primary direction of the market more clearly than standard price action alone.
//+------------------------------------------------------------------+
//|                                                       linreg.mq4 |
//|                                         Copyright © 2006, ch33z3 |
//|                                   http://4xjournal.blogspot.com/ |
//+------------------------------------------------------------------+
#property  copyright "Copyright © 2006, ch33z3"
#property  link      "http://4xjournal.blogspot.com/"
//----
#property indicator_chart_window
#property indicator_buffers 1
#property indicator_color1 Blue
//----
extern int LRPeriod=13;
double ind_buffer[];
//+------------------------------------------------------------------+
//|                                                                  |
//+------------------------------------------------------------------+
int init()
  {
   IndicatorBuffers(1);
   SetIndexStyle(0,DRAW_LINE,0,1);
   SetIndexBuffer(0,ind_buffer);
   return(0);
  }
//+------------------------------------------------------------------+
//|                                                                  |
//+------------------------------------------------------------------+
int start()
  {
   int limit, i;
   int counted_bars=IndicatorCounted();
   if(counted_bars<0) return(-1);
   if(counted_bars>0) counted_bars--;
   limit=Bars-counted_bars;
     for(i=limit; i>=0; i--)
     {
      ind_buffer[i]=linreg(LRPeriod,i);
     }
   return(ind_buffer[0]);
  }
//+------------------------------------------------------------------+
double linreg(int p,int i)
  {
   double SumY=0;
   double Sum1=0;
   double Slope=0;
   double c;
     for(int x=0; x<=p-1;x++)
     {
      c=Close[x+i];
      SumY+=c;
     Sum1+=x*c;
     }
   double SumBars=p*(p-1)*0.5;
   double SumSqrBars=(p-1)*p*(2*p-1)/6;
   double Sum2=SumBars*SumY;
   double Num1=p*Sum1-Sum2;
   double Num2=SumBars*SumBars-p*SumSqrBars;
   if(Num2!=0) Slope=Num1/Num2;
   else Slope=0;
   double Intercept=(SumY-Slope*SumBars)/p;
   double linregval=Intercept+Slope*(p-1);
   return(linregval);
  }
//+------------------------------------------------------------------+
Comments