Laguerre RSI_v2
Download script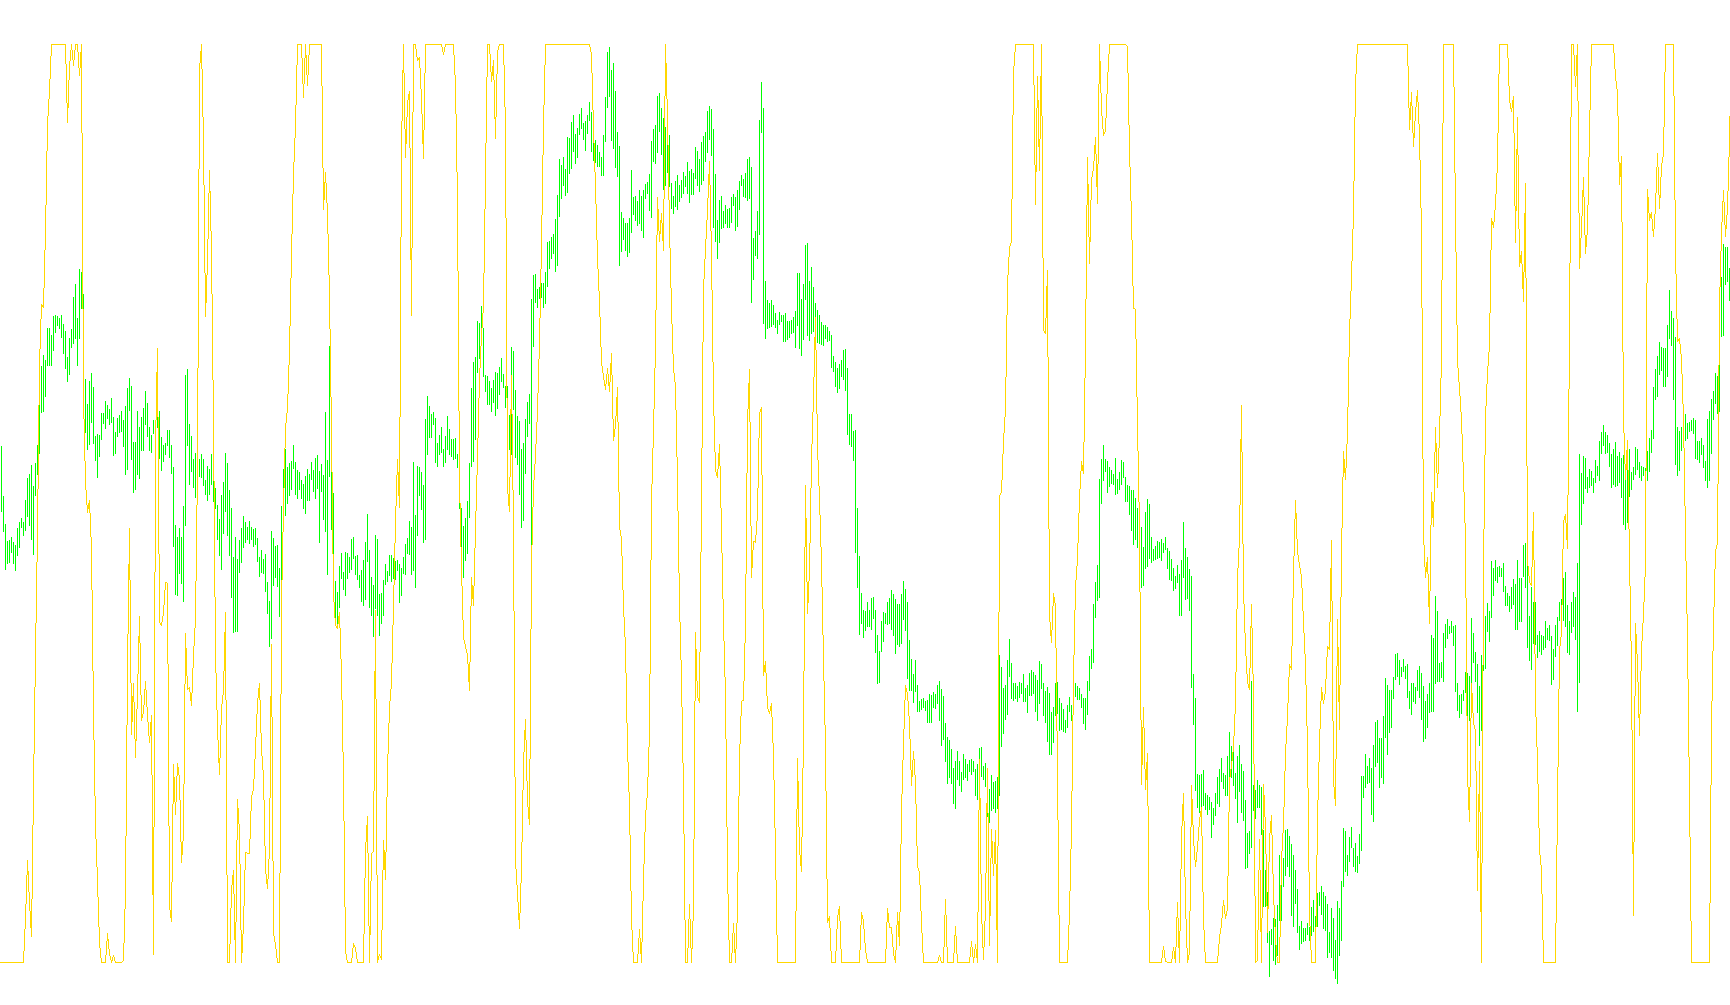
The Laguerre RSI is a specialized technical analysis tool designed to help traders visualize market momentum and price velocity more smoothly than traditional indicators. By processing price data through a multi-layered mathematical filter, it identifies whether the market is currently in an "overbought," "oversold," or neutral state, while significantly reducing the "noise" often found in standard price charts.
Core Logic and Functionality
The script operates by analyzing the relationship between current and past closing prices through a series of rolling calculations. Here is a breakdown of how it processes information:
1. The Smoothing Filter (Laguerre Layers) Instead of looking at the price in isolation, the tool creates four distinct "layers" of data (referred to as L0 through L3). Each layer takes a portion of the current price and blends it with the previous values from its own history. This creates a cascading effect where each layer becomes progressively smoother than the last. By doing this, the indicator can "remember" recent trends while ignoring sudden, insignificant price spikes.
2. Measuring Momentum (Upward vs. Downward Force) Once these four layers are established, the script compares them against one another to determine the direction of the market movement:
- It calculates the distance between the layers to see if they are moving apart or pulling together.
- It accumulates the "Upward" force (positive differences) and the "Downward" force (negative differences).
3. The Final RSI Calculation The final value shown on your chart is a ratio. It takes the total Upward Force and divides it by the sum of both Upward and Downward forces.
- If the market is pushing aggressively upward, the indicator moves toward the top of its range.
- If the market is pushing downward, it moves toward the bottom.
- If the forces are balanced, the indicator centers itself.
Key Features for Traders
- Visual Boundaries: The script includes pre-defined levels (such as 0.75 and 0.15). These act as visual "warning zones," helping you identify when a trend might be reaching an extreme point and potentially exhausting its strength.
- Sensitivity Adjustment: Through the "Gamma" setting, the tool can be tuned to be more responsive to quick price changes or more stable for long-term trend following.
- Reduced Lag: Because of its specific mathematical structure (the Laguerre logic), this indicator aims to provide a cleaner look at momentum than standard RSI models, which can sometimes react too slowly to sudden market shifts.
//+------------------------------------------------------------------+
//|                                                 Laguerre RSI.mq4 |
//|                                Copyright © 2005, David W. Thomas |
//|                                           mailto:davidwt@usa.net |
//+------------------------------------------------------------------+
// based on http://www.mesasoftware.com/TimeWarp.doc.
#property copyright "Copyright © 2005, David W. Thomas"
#property link      "mailto:davidwt@usa.net"
//----
#property indicator_separate_window
#property indicator_level2 0.75
#property indicator_level3 0.45
#property indicator_level4 0.15
#property indicator_minimum 0
#property indicator_maximum 1
#property indicator_buffers 1
#property indicator_color1 MediumPurple
//---- input parameters
extern double    gamma=0.7;
//---- buffers
double RSI[];
double L0[];
double L1[];
double L2[];
double L3[];
//+------------------------------------------------------------------+
//| Custom indicator initialization function                         |
//+------------------------------------------------------------------+
int init()
  {
   IndicatorBuffers(5);
//---- indicators
   SetIndexStyle(0, DRAW_LINE);
   SetIndexDrawBegin(0, 1);
   SetIndexLabel(0, "Laguerre RSI");
   SetIndexEmptyValue(0, -0.01);
   SetIndexBuffer(0, RSI);
   SetIndexBuffer(1, L0);
   SetIndexBuffer(2, L1);
   SetIndexBuffer(3, L2);
   SetIndexBuffer(4, L3);
//----
   string short_name="LaguerreRSI(" + DoubleToStr(gamma, 2) + ")";
   IndicatorShortName(short_name);
   return(0);
  }
//+------------------------------------------------------------------+
//| Custor indicator deinitialization function                       |
//+------------------------------------------------------------------+
int deinit()
  {
   return(0);
  }
//+------------------------------------------------------------------+
//| Custom indicator iteration function                              |
//+------------------------------------------------------------------+
int start()
  {
   int    limit;
   int    counted_bars=IndicatorCounted();
   double CU, CD;
//---- last counted bar will be recounted
   if (counted_bars>0)
      counted_bars--;
   else
      counted_bars=1;
   limit=Bars - counted_bars;
//---- computations for RSI
   for(int i=limit; i>=0; i--)
     {
      L0[i]=(1.0 - gamma)*Close[i] + gamma*L0[i+1];
      L1[i]=-gamma*L0[i] + L0[i+1] + gamma*L1[i+1];
      L2[i]=-gamma*L1[i] + L1[i+1] + gamma*L2[i+1];
      L3[i]=-gamma*L2[i] + L2[i+1] + gamma*L3[i+1];
      //Print(i," Close[i]=",Close[i],", (1.0 - gamma)*Close[i]=",(1.0 - gamma)*Close[i],", gamma*L0[i+1]=",gamma*L0[i+1]);
      //Print(i," L0=",L0[i],",L1=",L1[i],",L2=",L2[i],",L3=",L3[i]);
      CU=0;
      CD=0;
      if (L0[i]>=L1[i])
         CU=L0[i] - L1[i];
      else
         CD=L1[i] - L0[i];
      if (L1[i]>=L2[i])
         CU=CU + L1[i] - L2[i];
      else
         CD=CD + L2[i] - L1[i];
      if (L2[i]>=L3[i])
         CU=CU + L2[i] - L3[i];
      else
         CD=CD + L3[i] - L2[i];
      if (CU + CD!=0)
         RSI[i]=CU/(CU + CD);
     }
   return(0);
  }
//+------------------------------------------------------------------+
Comments