Laguerre RSI_v1
Download script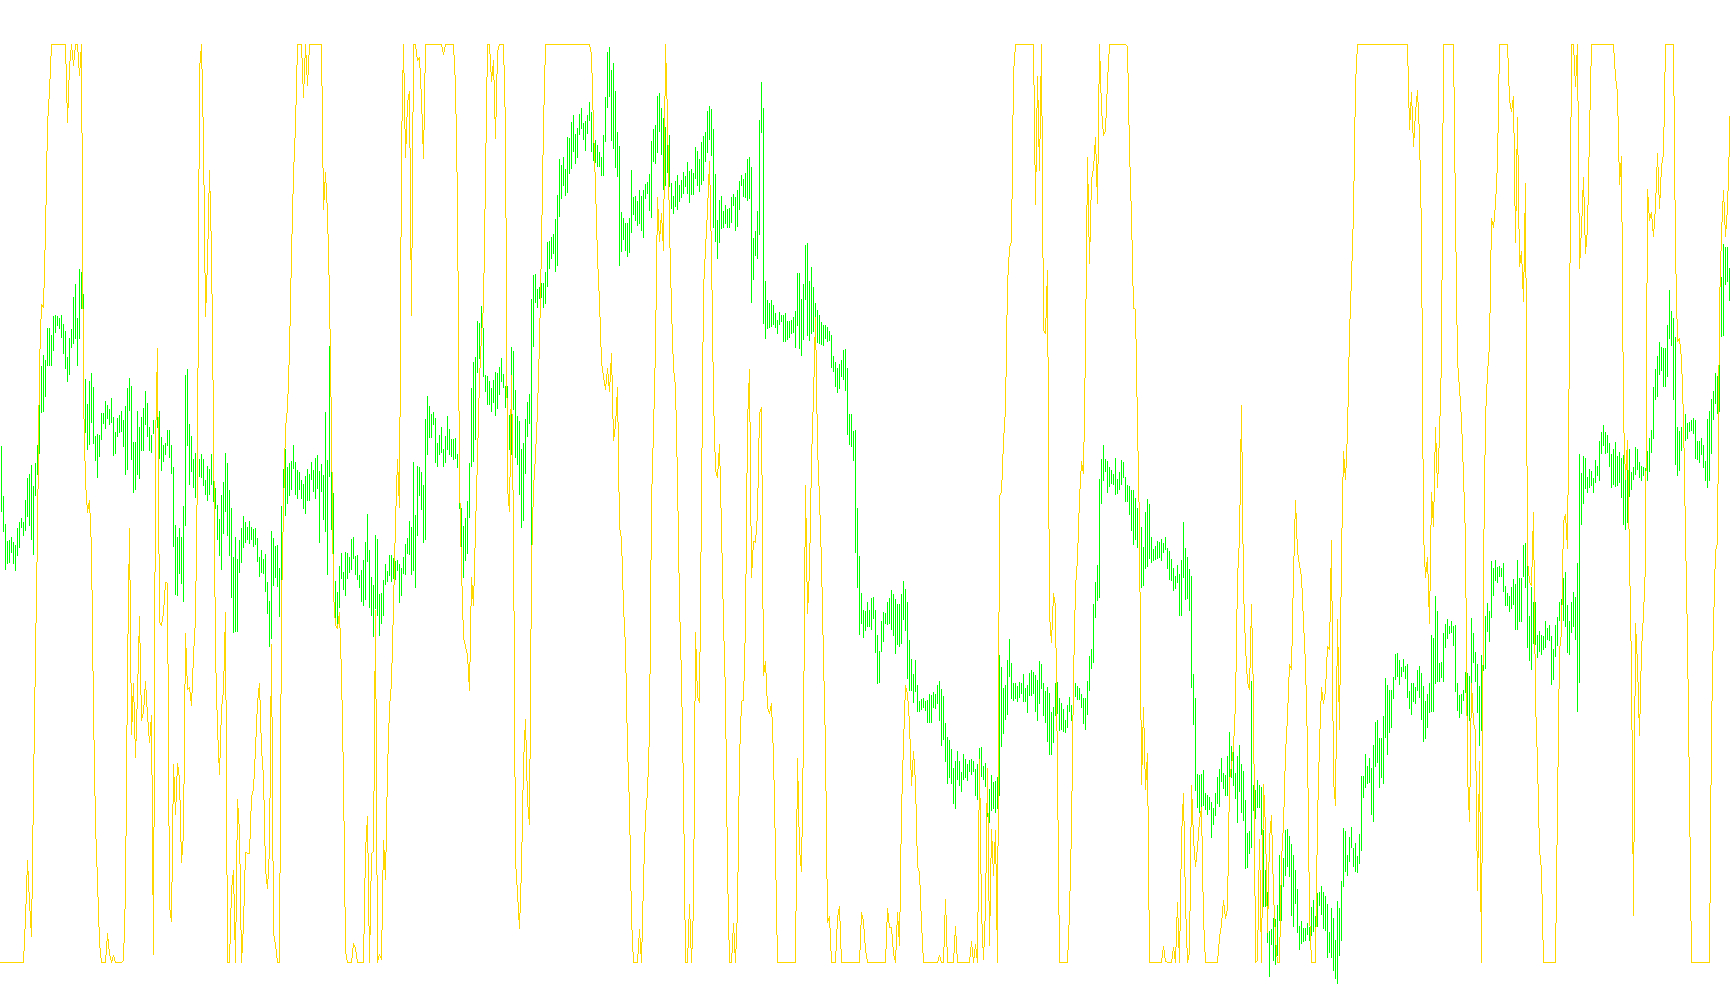
This tool is a specialized technical analysis indicator designed to measure the momentum of an asset's price movement. While it shares some similarities with the standard Relative Strength Index (RSI), it utilizes a specific mathematical approach known as the Laguerre algorithm to provide a smoother, more refined view of market dynamics.
How the Logic Works
The indicator operates by processing price data through a series of sequential calculations to filter out "market noise" while still reacting to significant price changes. Here is a breakdown of the underlying logic:
1. Smoothing and Weighting (The Laguerre Components) Instead of looking at the raw price directly, the script creates four distinct layers of data (referred to internally as L0 through L3). Each layer uses a specific weight—controlled by a primary setting called "Gamma"—to calculate the previous state of the market relative to the current price. This cascading system allows the indicator to "remember" recent trends without being overly distracted by tiny, insignificant fluctuations in price.
2. Calculating Price Movement (Upward vs. Downward) Once these four layers are established, the script compares them against one another to determine the direction of the momentum. It looks at the differences between each layer:
- If a higher layer is greater than a lower one, it contributes to the Upward Momentum.
- If a higher layer is smaller than a lower one, it contributes to the Downward Momentum.
By comparing these layers against each other in sequence, the tool creates a cumulative sum of how strongly the price is pushing in either direction at any given moment.
3. The Final Output (The RSI Ratio) The final result displayed on your chart is a ratio. It takes the total Upward Momentum and divides it by the sum of both Upward and Downward momentum.
This results in a value constrained between 0 and 1:
- A value closer to 1 suggests that upward momentum is dominant.
- A value closer to 0 suggests that downward momentum is dominant.
- The middle ground represents a balance between the two forces.
Summary for Traders
In simple terms, this script acts as a sophisticated "momentum filter." It processes the price history through several layers of smoothing to determine whether the current market trend is leaning more towards the upside or the downside. By providing a cleaner signal than many standard oscillators, it helps traders identify the strength behind a move rather than just the direction of the price itself.
/*-----------------------------+
|			       |
| Shared by www.Aptrafx.com    |
|			       |
+------------------------------*/

//+------------------------------------------------------------------+
//|                                                 Laguerre RSI.mq4 |
//|                                Copyright © 2005, David W. Thomas |
//|                                           mailto:davidwt@usa.net |
//+------------------------------------------------------------------+
// based on http://www.mesasoftware.com/TimeWarp.doc.
#property copyright "Copyright © 2005, David W. Thomas"
#property link      "mailto:davidwt@usa.net"

#property indicator_separate_window
#property indicator_level2 0.75
#property indicator_level3 0.45
#property indicator_level4 0.15
#property indicator_minimum 0
#property indicator_maximum 1
#property indicator_buffers 1
#property indicator_color1 MediumPurple

//---- input parameters
extern double    gamma=0.7;

//---- buffers
double RSI[];
double L0[];
double L1[];
double L2[];
double L3[];

//+------------------------------------------------------------------+
//| Custom indicator initialization function                         |
//+------------------------------------------------------------------+
int init()
{
   IndicatorBuffers(5);
//---- indicators
   SetIndexStyle(0, DRAW_LINE);
   SetIndexDrawBegin(0, 1);
	SetIndexLabel(0, "Laguerre RSI");
	SetIndexEmptyValue(0, -0.01);
   SetIndexBuffer(0, RSI);
   SetIndexBuffer(1, L0);
   SetIndexBuffer(2, L1);
   SetIndexBuffer(3, L2);
   SetIndexBuffer(4, L3);
//----
   string short_name="LaguerreRSI(" + DoubleToStr(gamma, 2) + ")";
   IndicatorShortName(short_name);
   return(0);
}

//+------------------------------------------------------------------+
//| Custor indicator deinitialization function                       |
//+------------------------------------------------------------------+
int deinit()
{
   return(0);
}

//+------------------------------------------------------------------+
//| Custom indicator iteration function                              |
//+------------------------------------------------------------------+
int start()
{
	int    limit;
	int    counted_bars = IndicatorCounted();
	double CU, CD;
	//---- last counted bar will be recounted
	if (counted_bars>0)
		counted_bars--;
	else
		counted_bars = 1;
	limit = Bars - counted_bars;
	//---- computations for RSI
	for (int i=limit; i>=0; i--)
	{
		L0[i] = (1.0 - gamma)*Close[i] + gamma*L0[i+1];
		L1[i] = -gamma*L0[i] + L0[i+1] + gamma*L1[i+1];
		L2[i] = -gamma*L1[i] + L1[i+1] + gamma*L2[i+1];
		L3[i] = -gamma*L2[i] + L2[i+1] + gamma*L3[i+1];
		//Print(i," Close[i]=",Close[i],", (1.0 - gamma)*Close[i]=",(1.0 - gamma)*Close[i],", gamma*L0[i+1]=",gamma*L0[i+1]);
		//Print(i," L0=",L0[i],",L1=",L1[i],",L2=",L2[i],",L3=",L3[i]);

		CU = 0;
		CD = 0;
		if (L0[i] >= L1[i])
			CU = L0[i] - L1[i];
		else
			CD = L1[i] - L0[i];
		if (L1[i] >= L2[i])
			CU = CU + L1[i] - L2[i];
		else
			CD = CD + L2[i] - L1[i];
		if (L2[i] >= L3[i])
			CU = CU + L2[i] - L3[i];
		else
			CD = CD + L3[i] - L2[i];

		if (CU + CD != 0)
			RSI[i] = CU / (CU + CD);
	}
   return(0);
}
//+------------------------------------------------------------------+
Comments