KLines
Download script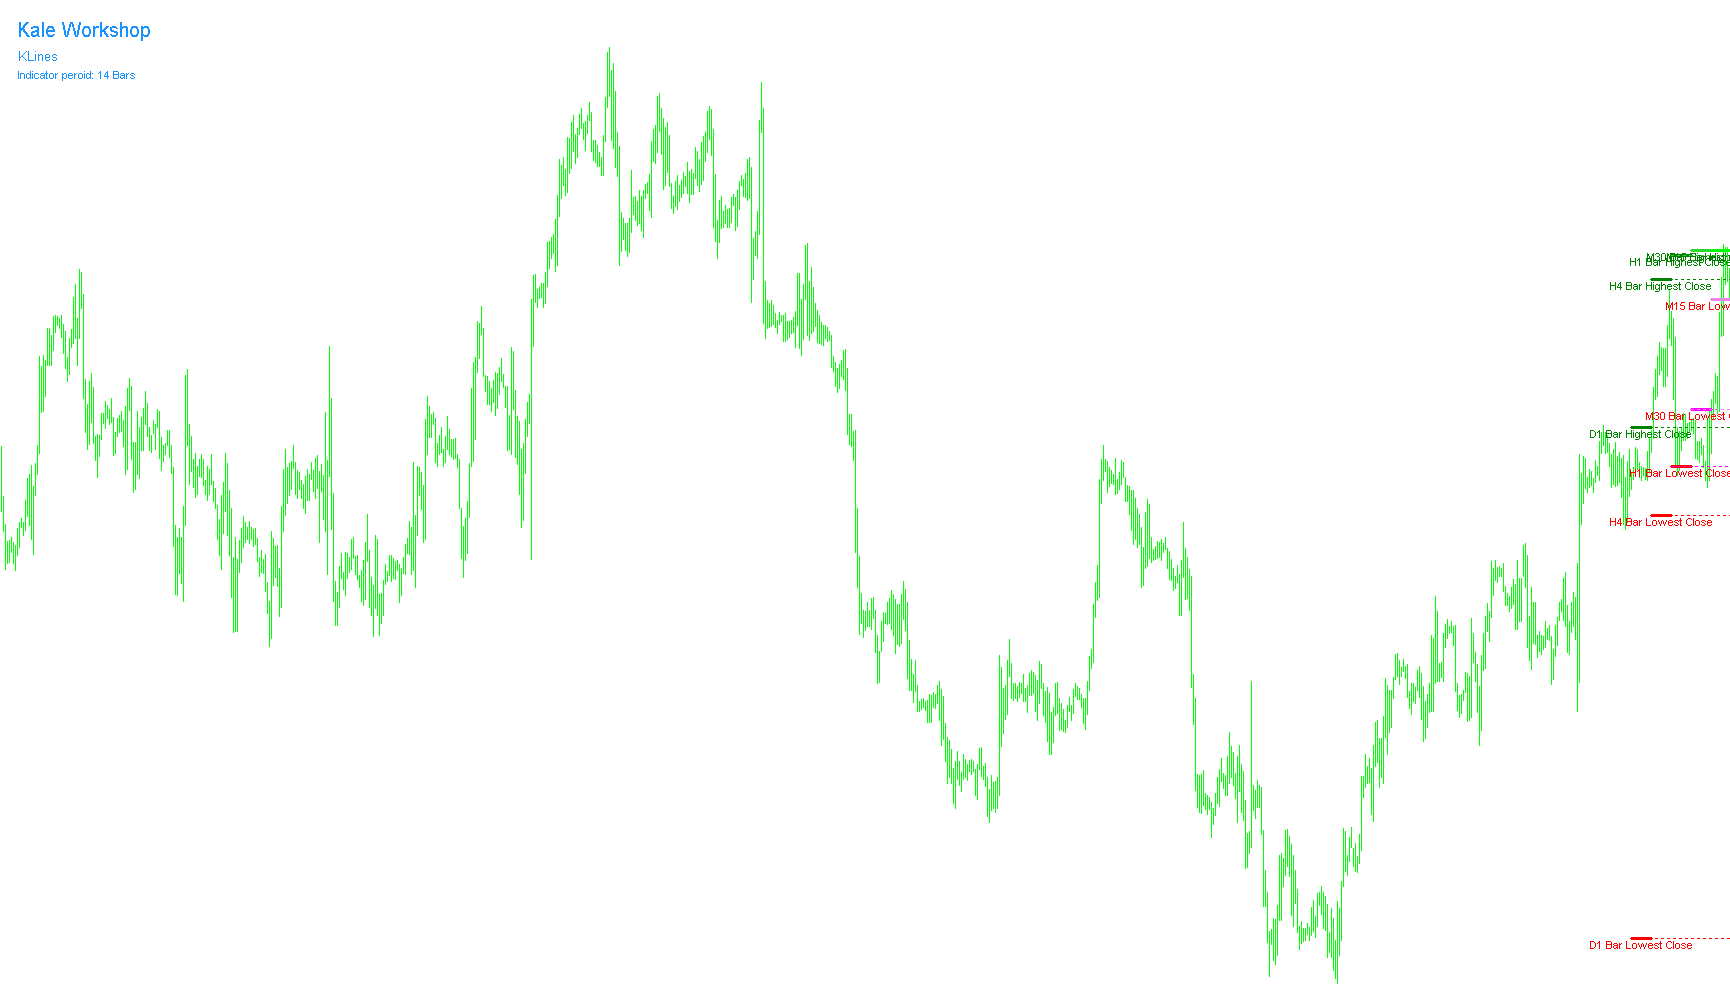
This script is designed to provide a visual multi-timeframe analysis of significant price levels directly on your trading chart. Rather than requiring you to switch back and forth between different timeframes (like Daily, Hourly, or Minutes) to see where important price action occurred in the past, this tool consolidates that information into one single view.
Core Functionality
The logic operates by identifying specific "High" and "Low" price points across five distinct timeframes simultaneously. It looks back over a user-defined period (set by default to 14 bars) to find the highest and lowest closing prices for each of the following intervals:
- Daily (D1)
- 4-Hour (H4)
- 1-Hour (H1)
- 30-Minute (M30)
- 15-Minute (M15)
Visual Representation
To make this data easy to interpret, the script draws horizontal levels on your chart. These are organized linearly across the screen to represent the progression of timeframes:
- Highest Price Levels: The script identifies the peak closing prices for each timeframe and draws corresponding lines. It uses a color gradient (ranging from Green to Lime) to distinguish between the different periods.
- Lowest Price Levels: Similarly, it identifies the lowest closing prices and draws them as distinct lines using a different color spectrum (ranging from Red to Violet).
- Dynamic Labeling: Each line is accompanied by a text label that explicitly states which timeframe it refers to (e.g., "D1 Bar Highest Close"), ensuring you can instantly identify the significance of each price level without confusion.
Technical Execution Logic
- Automated Tracking: The script constantly monitors the live market data and updates these lines automatically as new candles form.
- Clean Interface: It includes a built-in dashboard in the corner of your chart that identifies the tool and displays the current "Period" setting, so you always know the lookback depth being calculated.
- Object Management: The script is programmed to intelligently manage its visual elements—it creates new lines when necessary and cleans up old data to ensure your chart remains organized and readable.
Summary for the Trader
Essentially, this tool acts as a "Price Map." By looking at it, you can see at a glance where the major price boundaries were established across multiple timeframes at once. This helps in identifying potential support and resistance zones where the market has shown significant strength or weakness in the recent past.
//+------------------------------------------------------------------+
//|                                                       KLines.mq4 |
//|                                                          Kalenzo |
//|                                      bartlomiej.gorski@gmail.com |
//+------------------------------------------------------------------+
#property copyright "Kalenzo"
#property link      "bartlomiej.gorski@gmail.com"
//----
extern int KLPeriod=14;
#property indicator_chart_window
//+------------------------------------------------------------------+
//| Custom indicator initialization function                         |
//+------------------------------------------------------------------+
int init()
  {
//---- indicators
   drawLabel();
//----
   return(0);
  }
//+------------------------------------------------------------------+
//| Custom indicator deinitialization function                       |
//+------------------------------------------------------------------+
int deinit()
  {
//----
   ObjectsDeleteAll() ;
//----
   return(0);
  }
//+------------------------------------------------------------------+
//| Custom indicator iteration function                              |
//+------------------------------------------------------------------+
int start()
  {
//----
   double hhmd =iClose(NULL,PERIOD_D1, Highest (NULL,PERIOD_D1, MODE_CLOSE, KLPeriod,1));
   double hhmh4=iClose(NULL,PERIOD_H4, Highest (NULL,PERIOD_H4, MODE_CLOSE, KLPeriod,1));
   double hhmh1=iClose(NULL,PERIOD_H1, Highest (NULL,PERIOD_H1, MODE_CLOSE, KLPeriod,1));
   double hhm30=iClose(NULL,PERIOD_M30, Highest (NULL,PERIOD_M30, MODE_CLOSE, KLPeriod,1));
   double hhm15=iClose(NULL,PERIOD_M15, Highest (NULL,PERIOD_M15, MODE_CLOSE, KLPeriod,1));
   //
   drawLine("HH_D1",Time[50],Time[40],hhmd,hhmd,3,0,Green,1);
   drawLine("HH_H4",Time[40],Time[30],hhmh4,hhmh4,3,0,Green,1);
   drawLine("HH_H1",Time[30],Time[20],hhmh1,hhmh1,3,0,Green,2);
   drawLine("HH_M30",Time[20],Time[10],hhm30,hhm30,3,0,LimeGreen,2);
   drawLine("HH_M15",Time[10],Time[0],hhm15,hhm15,3,0,Lime,1);
   drawLine("HH_D1r",Time[50],Time[40],hhmd,hhmd,1,1,Green,0);
   drawLine("HH_H4r",Time[40],Time[30],hhmh4,hhmh4,1,1,Green,0);
   drawLine("HH_H1r",Time[30],Time[20],hhmh1,hhmh1,1,1,LimeGreen,0);
   drawLine("HH_M30r",Time[20],Time[10],hhm30,hhm30,1,1,Lime,0);
   //
   drawTXTLabel("D1 Bar Highest Close",hhmd,Time[45],Green);
   drawTXTLabel("H4 Bar Highest Close",hhmh4,Time[35],Green);
   drawTXTLabel("H1 Bar Highest Close",hhmh1,Time[25],Green);
   drawTXTLabel("M30 Bar Highest Close",hhm30,Time[15],Green);
   drawTXTLabel("M15 Bar Highest Close",hhm15,Time[5],Green);
   //
   double llmd =iClose(NULL,PERIOD_D1, Lowest (NULL,PERIOD_D1, MODE_CLOSE, KLPeriod,1));
   double llmh4=iClose(NULL,PERIOD_H4, Lowest (NULL,PERIOD_H4, MODE_CLOSE, KLPeriod,1));
   double llmh1=iClose(NULL,PERIOD_H1, Lowest (NULL,PERIOD_H1, MODE_CLOSE, KLPeriod,1));
   double llm30=iClose(NULL,PERIOD_M30, Lowest (NULL,PERIOD_M30, MODE_CLOSE, KLPeriod,1));
   double llm15=iClose(NULL,PERIOD_M15, Lowest (NULL,PERIOD_M15, MODE_CLOSE, KLPeriod,1));
   //
   drawLine("LL_D1",Time[50],Time[40],llmd,llmd,3,0,Red,1);
   drawLine("LL_H4",Time[40],Time[30],llmh4,llmh4,3,0,Red,1);
   drawLine("LL_H1",Time[30],Time[20],llmh1,llmh1,3,0,Red,2);
   drawLine("LL_M30",Time[20],Time[10],llm30,llm30,3,0,Magenta,2);
   drawLine("LL_M15",Time[10],Time[0],llm15,llm15,3,0,Violet,1);
   drawLine("LL_D1r",Time[50],Time[40],llmd,llmd,1,1,Red,0);
   drawLine("LL_H4r",Time[40],Time[30],llmh4,llmh4,1,1,Red,0);
   drawLine("LL_H1r",Time[30],Time[20],llmh1,llmh1,1,1,Magenta,0);
   drawLine("LL_M30r",Time[20],Time[10],llm30,llm30,1,1,Violet,0);
   //
   drawTXTLabel("D1 Bar Lowest Close",llmd,Time[45],Red);
   drawTXTLabel("H4 Bar Lowest Close",llmh4,Time[35],Red);
   drawTXTLabel("H1 Bar Lowest Close",llmh1,Time[25],Red);
   drawTXTLabel("M30 Bar Lowest Close",llm30,Time[15],Red);
   drawTXTLabel("M15 Bar Lowest Close",llm15,Time[5],Red);
//----
   return(0);
  }
//+------------------------------------------------------------------+
void drawTXTLabel(string name,double lvl,datetime time, color Color)
  {
   if(ObjectFind(name)!=0)
     {
      ObjectCreate(name, OBJ_TEXT, 0, time, lvl);
      ObjectSetText(name, name, 8, "Arial", EMPTY);
      ObjectSet(name, OBJPROP_COLOR, Color);
     }
   else
     {
      ObjectMove(name, 0, time, lvl);
     }
  }
//+------------------------------------------------------------------+
//|                                                                  |
//+------------------------------------------------------------------+
void drawLine(string name,datetime tfrom, datetime tto, double pfrom, double pto, int width, int ray, color Col,int type)
  {
   if(ObjectFind(name)!=0)
     {
      ObjectCreate(name, OBJ_TREND, 0, tfrom, pfrom,tto,pto);
//----
      if(type==1)
         ObjectSet(name, OBJPROP_STYLE, STYLE_SOLID);
      else if(type==2)
            ObjectSet(name, OBJPROP_STYLE, STYLE_DASHDOT);
         else
            ObjectSet(name, OBJPROP_STYLE, STYLE_DOT);
//----
      ObjectSet(name, OBJPROP_COLOR, Col);
      ObjectSet(name,OBJPROP_WIDTH,width);
      ObjectSet(name,OBJPROP_RAY,ray);
     }
   else
     {
      ObjectDelete(name);
      ObjectCreate(name, OBJ_TREND, 0, tfrom, pfrom,tto,pto);

      if(type==1)
         ObjectSet(name, OBJPROP_STYLE, STYLE_SOLID);
      else if(type==2)
            ObjectSet(name, OBJPROP_STYLE, STYLE_DASHDOT);
         else
            ObjectSet(name, OBJPROP_STYLE, STYLE_DOT);
//----
      ObjectSet(name, OBJPROP_COLOR, Col);
      ObjectSet(name,OBJPROP_WIDTH,width);
      ObjectSet(name,OBJPROP_RAY,ray);
     }
  }
//+------------------------------------------------------------------+
//|                                                                  |
//+------------------------------------------------------------------+
void drawLabel()
  {
   ObjectCreate("KLabelKLines", OBJ_LABEL, 0, 0, 0);
   ObjectSetText("KLabelKLines","Kale Workshop", 15, "Arial", EMPTY);
   ObjectSet("KLabelKLines", OBJPROP_COLOR, DodgerBlue);
   ObjectSet("KLabelKLines", OBJPROP_CORNER, 0);
   ObjectSet("KLabelKLines", OBJPROP_XDISTANCE, 20);
   ObjectSet("KLabelKLines", OBJPROP_YDISTANCE, 20);
   ObjectCreate("InameKLines", OBJ_LABEL, 0, 0, 0);
   ObjectSetText("InameKLines","KLines", 10, "Arial", EMPTY);
   ObjectSet("InameKLines", OBJPROP_COLOR, DodgerBlue);
   ObjectSet("InameKLines", OBJPROP_CORNER, 0);
   ObjectSet("InameKLines", OBJPROP_XDISTANCE, 21);
   ObjectSet("InameKLines", OBJPROP_YDISTANCE, 50);
//----
   string desc="Indicator peroid: "+KLPeriod+" Bars";
   ObjectCreate("DescKLines", OBJ_LABEL, 0, 0, 0);
   ObjectSetText("DescKLines",desc, 8, "Arial", EMPTY);
   ObjectSet("DescKLines", OBJPROP_COLOR, DodgerBlue);
   ObjectSet("DescKLines", OBJPROP_CORNER, 0);
   ObjectSet("DescKLines", OBJPROP_XDISTANCE, 21);
   ObjectSet("DescKLines", OBJPROP_YDISTANCE, 70);
  }
//+------------------------------------------------------------------+
Comments