#_i_FFT_separate_EURUSD_USDCHF
Download script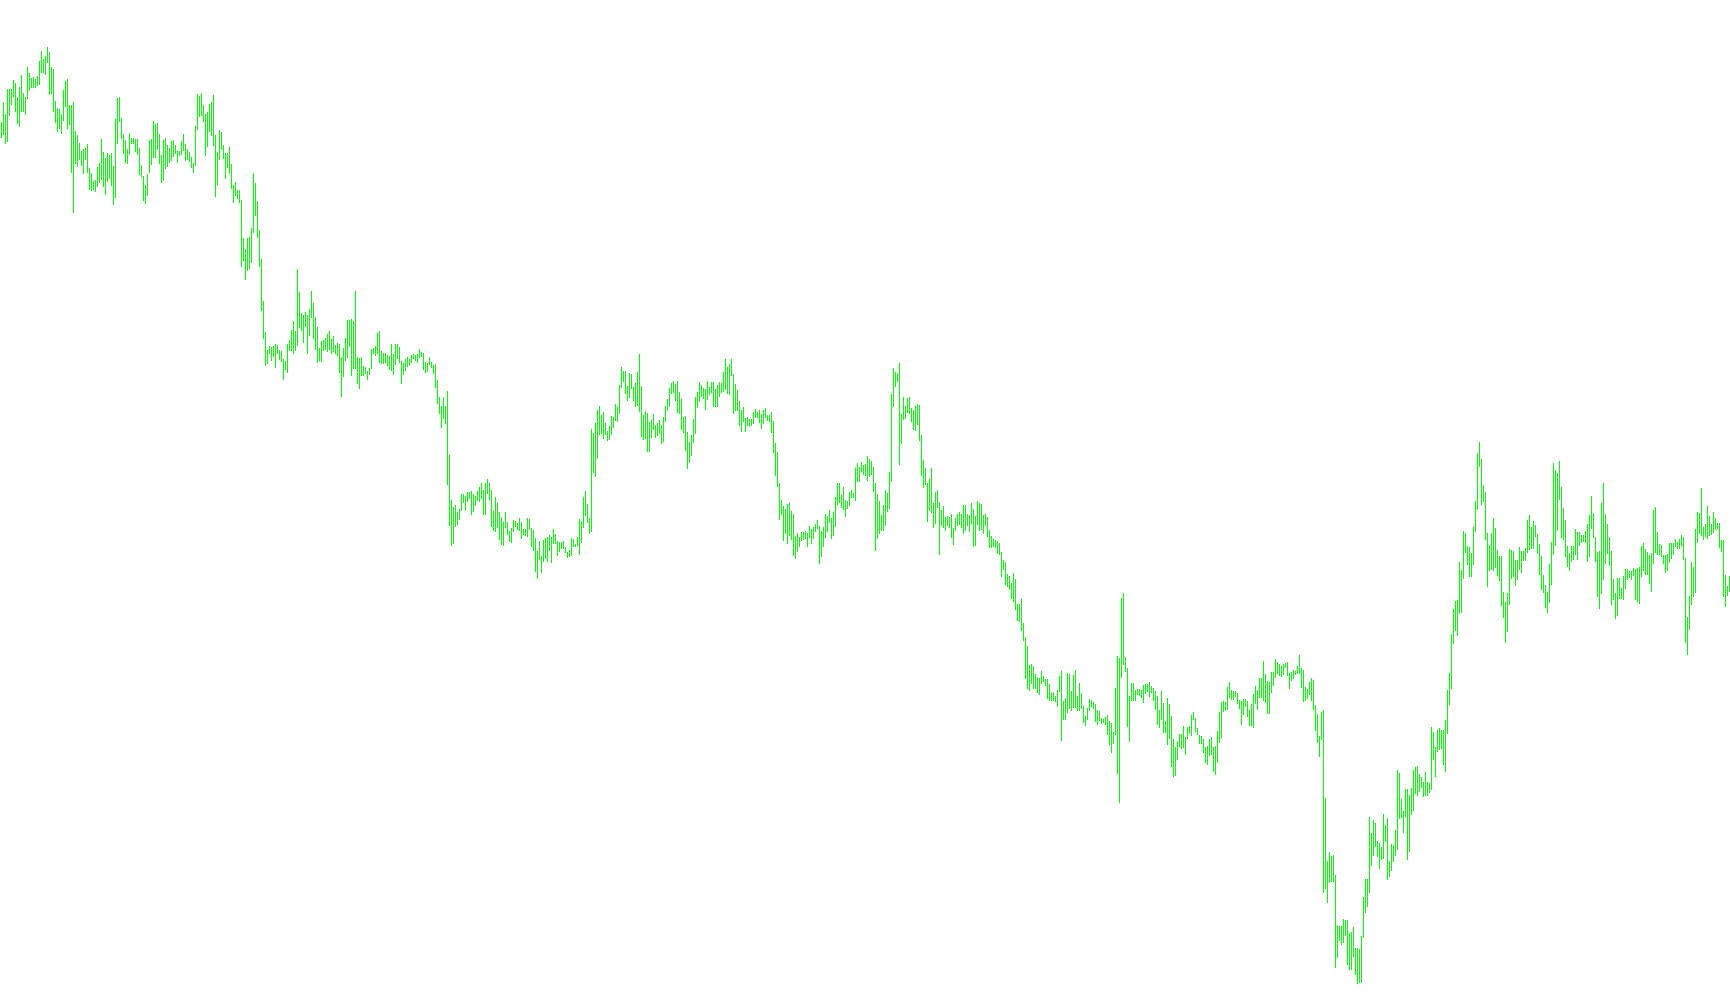
This script is a sophisticated technical analysis tool designed to measure and visualize the relationship between two different financial assets (for example, comparing how one currency pair moves in relation to another). Instead of looking at simple price movements, it uses advanced mathematical principles from signal processing to identify hidden patterns and correlations.
How the Logic Works
1. Data Collection and Synchronization The script begins by pulling historical price data from two different symbols simultaneously. It organizes this data into specific "windows" or segments. By looking at these assets side-by-side, the tool prepares to see if one asset's behavior mimics or reacts to the other.
2. Frequency Transformation (FFT) The core of this tool relies on a mathematical process called a Fast Fourier Transform (FFT). In simple terms, FFT takes a complex, messy price wave and breaks it down into its individual "frequencies." Think of it like taking a musical chord and identifying every individual note that makes it up. By converting price action into frequencies, the script can analyze the underlying rhythm of the market rather than just the surface-level noise.
3. Filtering and Refinement Once the data is converted into frequencies, the tool applies a "filter." It allows you to set boundaries (minimum and maximum limits) to ignore low-level background noise or extremely high-frequency jitters. This ensures that the final analysis focuses only on the most meaningful movements that are significant enough to impact trading decisions.
4. Correlation and Comparison After filtering, the script performs a cross-correlation. It mathematically "slides" the data of one asset against the other to see how well they align. It calculates a combined result that highlights how closely the two assets are moving in sync. This is used to identify:
- How much one asset leads or lags behind another.
- The strength of the relationship between the two markets.
5. Visual Output Finally, the script translates these complex calculations back into a visual format on your chart. It provides four distinct visual layers:
- Histograms and Lines: These represent the processed data for both assets after they have been filtered and analyzed.
- Moving Average: The tool calculates a smooth average of the resulting correlation, helping to identify broader trends in the relationship between the two symbols, making it easier to spot sustained patterns rather than temporary spikes.
Summary for the User
Essentially, this script doesn't just tell you if a price is going up or down; it tells you how it is moving by comparing its "heartbeat" to another market. It filters out the noise of the market to show you the underlying structural relationship between two assets, helping you identify patterns that are invisible to the naked eye.
//+------------------------------------------------------------------+
//|                                            #_i_SpecktrAnalis.mq4 |
//|                                          Copyright © 2006, klot. |
//|                                                     klot@mail.ru |
//+------------------------------------------------------------------+
#property copyright "Copyright © 2006, klot."
#property link      "klot@mail.ru"

/*
In signal processing, the cross-correlation (or sometimes "cross-covariance") is a measure
of similarity of two signals, commonly used to find features in an unknown signal by comparing
it to a known one. It is a function of the relative time between the signals, is sometimes called
the sliding dot product, and has applications in pattern recognition and cryptanalysis.
*/

#import "#_lib_FFT.ex4"
void realfastfouriertransform(double& a[], int tnn, bool inversefft);
void fastcorellation(double& signal[], int signallen,  double& pattern[],  int patternlen);
void tworealffts(double a1[], double a2[],  double& a[],  double& b[], int tn);
void fastconvolution(double& signal[], int signallen, double& response[], int negativelen, int positivelen);
#import

#property indicator_separate_window
#property indicator_buffers 4
#property indicator_color1 Red
#property indicator_color2 Lime
#property indicator_color3 Blue
#property indicator_color4 Aqua
#property indicator_level1 0.0
//#property indicator_level1 0.0
//#property indicator_level1 0.0
//---- buffers
double Buffer1[];
double Buffer2[];
double Buffer3[];
double Buffer4[];

//---
extern int n=7; // Äëèíà ðÿäà
extern int Fmin=2;//2; // Ãðíèöà Ôèëüòðà ïî Í×.
extern int Fmax=30;//128; // Ãðàíèöà Ôèëüòðà ïî Â×.
extern string sym1="EURUSD";
extern string sym2="USDCHF";
extern int MaPeriod=6;

double aa[];
double bb[];
double cc[];
double dd[];
int N;

//+------------------------------------------------------------------+
//| Custom indicator initialization function                         |
//+------------------------------------------------------------------+
int init()
  {

   if(StringFind(Symbol(),"m",0)>0)
   {
      sym1=sym1+"m";
      sym2=sym2+"m";
   }

//---- indicators
SetIndexStyle(0,DRAW_HISTOGRAM);
SetIndexBuffer(0,Buffer1);
SetIndexEmptyValue(0,0);
SetIndexStyle(1,DRAW_LINE,0,2);
SetIndexBuffer(1,Buffer2);
SetIndexEmptyValue(1,0);
SetIndexStyle(2,DRAW_LINE,0,1);
SetIndexBuffer(2,Buffer3);
SetIndexEmptyValue(2,0);
SetIndexStyle(3,DRAW_LINE,2,1);
SetIndexBuffer(3,Buffer4);
SetIndexEmptyValue(3,0);


//---
   N=MathPow(2,n);
   ArrayResize(aa,N);
   ArrayResize(bb,N);
   ArrayResize(cc,N);
   ArrayResize(dd,N);

if( Fmax>=N ) Fmax=N;
if( Fmin<=2 ) Fmin=2;

//----
   return(0);
  }
//+------------------------------------------------------------------+
//| Custom indicator deinitialization function                       |
//+------------------------------------------------------------------+
int deinit()
  {
//----

//----
   return(0);
  }
//+------------------------------------------------------------------+
//| Custom indicator iteration function                              |
//+------------------------------------------------------------------+
int start()
  {

   if( Bars<N) return(0);

   //---
   for(int i=N-1; i>=0; i--)
   {
     aa[i]=iClose(sym1,0,i);
     bb[i]=iClose(sym2,0,i);
     cc[i]=iClose(sym1,0,i);
     dd[i]=iClose(sym2,0,i);
   }

   realfastfouriertransform(aa, N, false);
   realfastfouriertransform(bb, N, false);
   realfastfouriertransform(cc, N, false);
   realfastfouriertransform(dd, N, false);


   N=ArraySize(aa);
   //Comment("n= ",N);
   //---
   for( i=0; i<=N-1; i++)
   {
      if( i<Fmin || i>Fmax)
      {
        aa[i]=0.0;
        bb[i]=0.0;
        cc[i]=0.0;
        dd[i]=0.0;
      }
   }
   //---
   realfastfouriertransform(aa, N, true);
   realfastfouriertransform(bb, N, true);
    double t1;
    double t2;
    cc[0] = cc[0]*dd[0];
    cc[1] = cc[1]*dd[1];
    for(i = 1; i <= N-1; i++)
    {
        t1 = cc[2*i];
        t2 = cc[2*i+1];
        cc[2*i] = t1*dd[2*i]+t2*dd[2*i+1];
        cc[2*i+1] = t2*dd[2*i]-t1*dd[2*i+1];
    }

   realfastfouriertransform(cc, N, true);
   //   fastcorellation(cc,N,dd,N);
   //fastconvolution(cc, N, dd, N, N);
   //tworealffts(aa, bb,  cc,  dd, N);


   //---
   SetIndexDrawBegin(0,Bars-N);
   SetIndexDrawBegin(1,Bars-N);
   SetIndexDrawBegin(2,Bars-N);
   SetIndexDrawBegin(3,Bars-N);
   //---
   for( i=0; i<=N-1; i++)
   {
      Buffer2[i]=aa[i];
      Buffer3[i]=bb[i];
      Buffer1[i]=cc[i];
   }
   //----
   //----
   for( i=0; i<=N-1; i++)
   {
     Buffer4[i]=iMAOnArray(Buffer1,0,MaPeriod,0,MODE_SMA,i);
   }

   return(0);
  }
//-------------------------------------------------------------------+
Comments