__i_FFT_Aver
Download script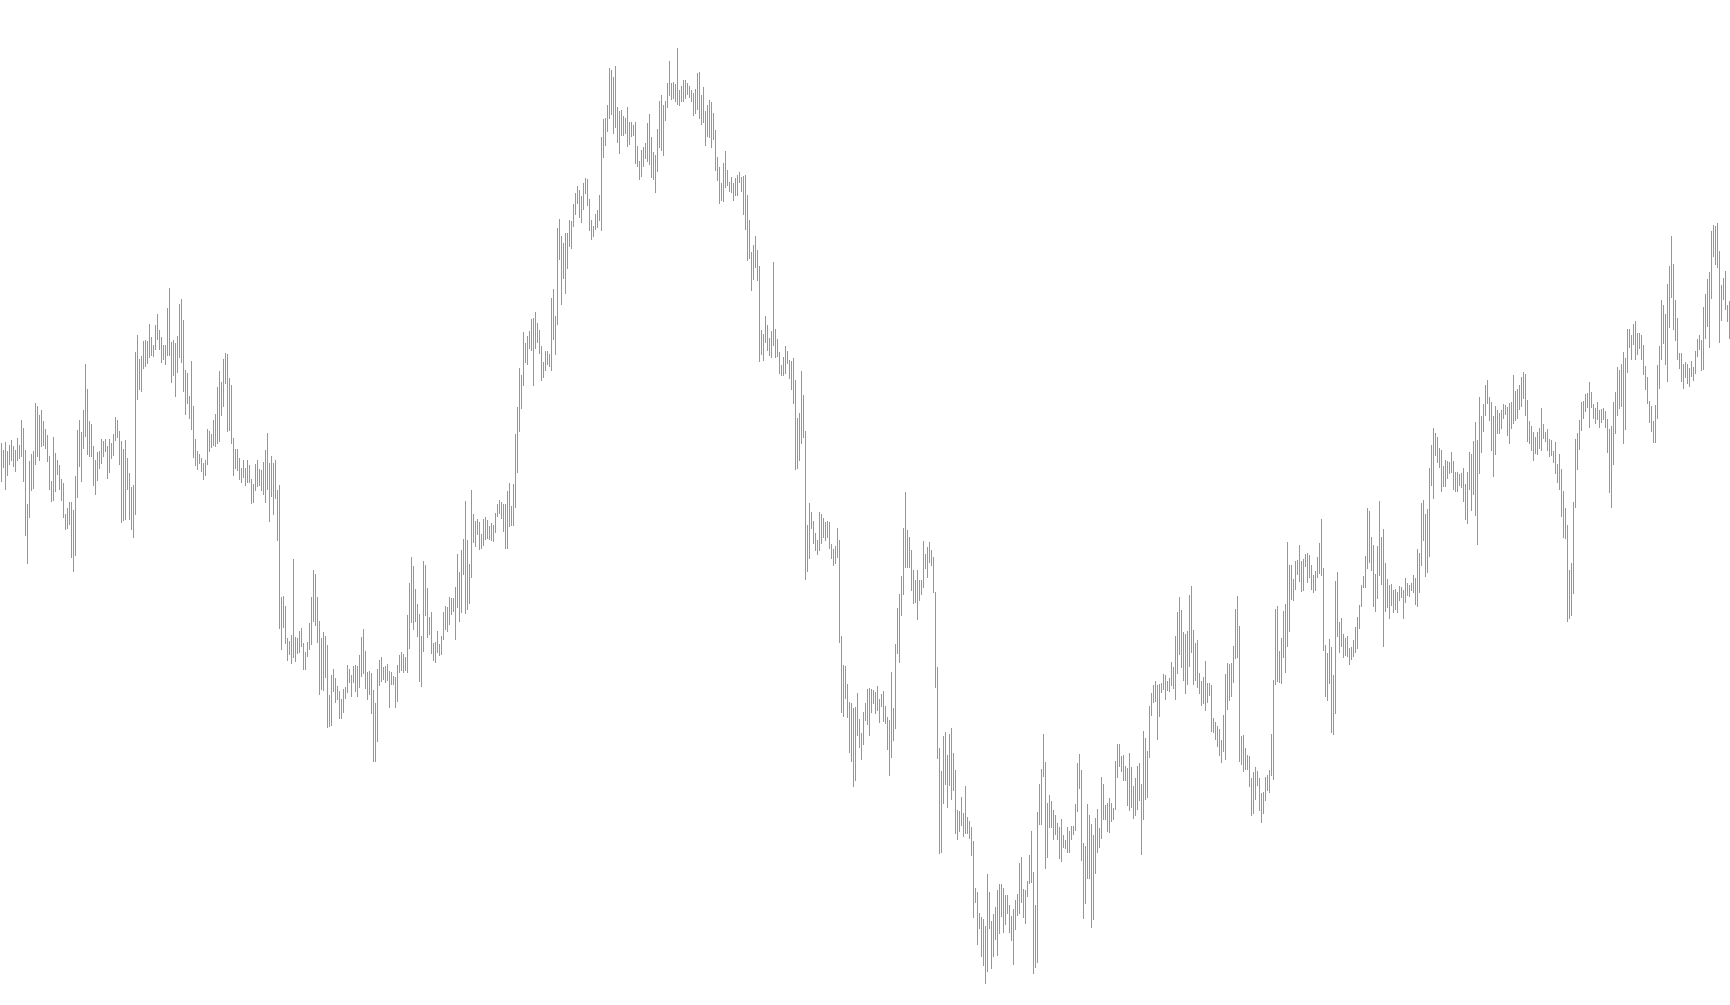
This script is designed to perform a sophisticated mathematical analysis of price action by identifying the underlying cycles and frequencies within a financial chart. Rather than looking at simple price movements, it attempts to break down the "noise" of the market into its fundamental periodic components.
How the Logic Works
The tool operates using a process known as a Fast Cosine Transform. To put this into perspective, think of how a prism breaks white light into individual colors, or how a musical instrument produces different notes from a single vibration. This script performs a similar action on price data:
- Data Collection: The tool looks at a specific window of recent closing prices (determined by the "Area for Analysis" setting).
- Frequency Decomposition: It converts these raw price points into a frequency spectrum. This allows the tool to see how much "energy" is present in different cycle lengths—for example, identifying if the market is currently being driven by short-term fluctuations or longer-term recurring waves.
- Filtering: The logic includes a specific smoothing and selection mechanism (the "Smoothing Coefficient"). It evaluates the results of the transformation and focuses on specific segments of the data, filtering out components that fall outside of the desired range.
- Reconstruction: Finally, it performs an inverse transform. By selectively keeping certain frequencies and removing others, it reconstructs a new visual representation of the data.
What this means for the user
The resulting output on your chart provides a visualization of the "filtered" market rhythm. Instead of seeing every erratic tick of the price, the indicator highlights the dominant cycles. This helps in identifying the primary waves governing the current market trend, effectively stripping away minor volatility to reveal the underlying structural patterns of the asset's movement.
//+------------------------------------------------------------------+
//|                                            #_i_SpecktrAnalis.mq4 |
//|                                          Copyright © 2006, klot. |
//|                                                     klot@mail.ru |
//+------------------------------------------------------------------+
#property copyright "Copyright © 2006, klot."
#property link      "klot@mail.ru"
//----
#define pi 3.14159265358979323846
//----
#import "#_lib_FFT.ex4"
void fastcosinetransform(double& a[], int tnn, bool inversefct);
#import
//----
#property indicator_chart_window
#property indicator_buffers 1
#property indicator_color1 Red
//---- buffers
double SpecktrBuffer[];
//----
extern double n = 7; // Äëèíà ðÿäà
extern int SS = 20; // Êîýôôèöèåíò ñãëàæèâàíèÿ
//----
int M, tnn1;
//----
double aa[];
//+------------------------------------------------------------------+
//| Custom indicator initialization function                         |
//+------------------------------------------------------------------+
int init()
  {
//---- indicators
   SetIndexStyle(0, DRAW_LINE, 0, 2);
   SetIndexBuffer(0, SpecktrBuffer);
//---
   tnn1 = MathPow(2, n);
   M = ArrayResize(aa, tnn1 + 1);
   if(SS > M)
       SS = M;
   SetIndexDrawBegin(0, Bars - M);
//----
   return(0);
  }
//+------------------------------------------------------------------+
//| Custom indicator deinitialization function                       |
//+------------------------------------------------------------------+
int deinit()
  {
//----
   return(0);
  }
//+------------------------------------------------------------------+
//| Custom indicator iteration function                              |
//+------------------------------------------------------------------+
int start()
  {
   int    counted_bars = IndicatorCounted();
   double sig;
   for(int i = M - 1; i >= 0; i--)
     {
       aa[i] = Close[i];
     }
   fastcosinetransform(aa, tnn1, false);
   //---
   int N = ArraySize(aa);
   //---
   for(i = 1; i <= N - 1; i++)
     {
       if(i >= SS)
           aa[i] = 0;
     }
   //---
   fastcosinetransform(aa, tnn1, true);
   //---
   for(i = 0; i <= N - 1; i++)
     {
       SpecktrBuffer[i] = aa[i];
     }
   //----
   return(0);
  }
//+------------------------------------------------------------------+
Comments