hull THV
Download script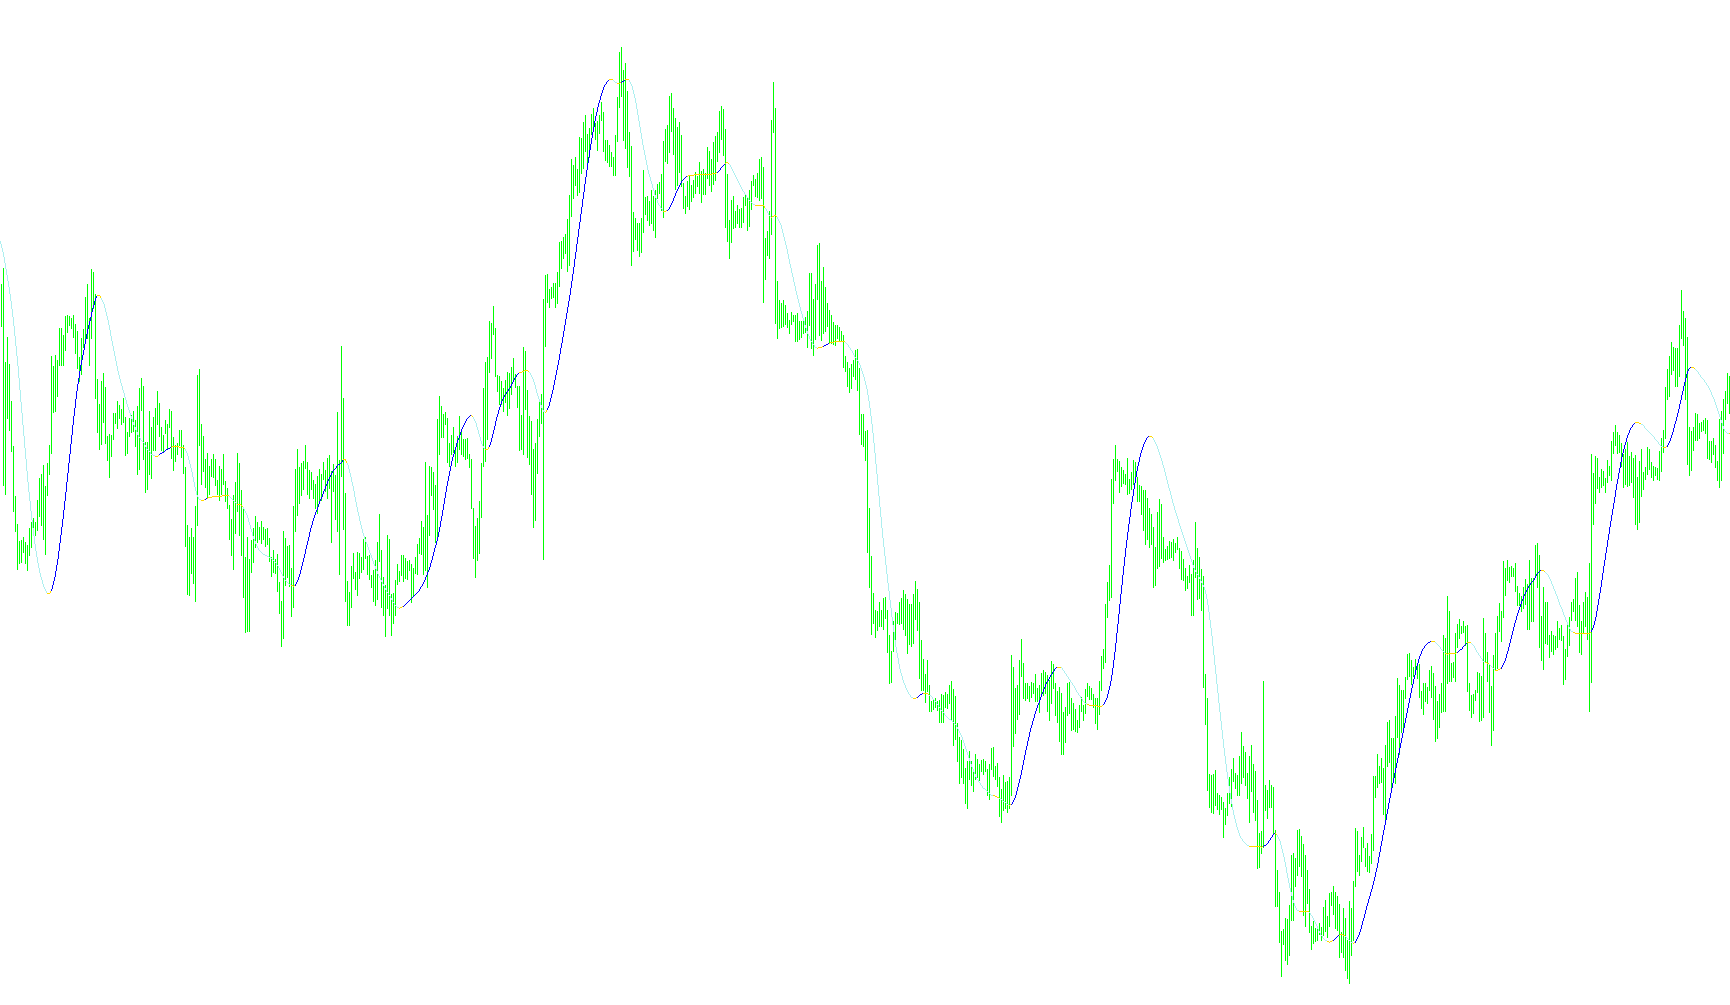
This tool is designed to provide traders with a smoothed, responsive moving average that helps identify the current direction of the market. Unlike standard moving averages which can sometimes lag behind significant price changes, this specific logic aims to balance smoothness with speed, allowing for a clearer view of momentum.
How the Logic Works
1. The Core Calculation (The Hull Moving Average) The script calculates a specialized moving average by looking at the relationship between two different weighted averages. It essentially takes a "snapshot" of recent price data and processes it in a way that reduces the typical delay found in standard indicators. By calculating these differences and then averaging them again, the tool creates a line that hugs the price action more closely while filtering out minor "noise" or erratic price fluctuations.
2. Customizable Sensitivity The behavior of the indicator is governed by two main settings:
- Period: This determines how much historical data the script looks at to make its calculations. A larger period makes the line smoother and slower, while a smaller period makes it more reactive to instant price movements.
- Slope: This acts as a threshold for trend detection. It defines how much the average must move in a specific direction before it is officially recognized as an upward or downward trend.
3. Visual Trend Identification The indicator does not just provide one line; it processes the data to identify three distinct visual states on your chart:
- The Main Line: This represents the primary moving average, showing the overall "flow" of the market.
- Upward Momentum: The script constantly compares the current value of the moving average to its previous value. If the increase exceeds your defined "Slope," the logic identifies this as a confirmed upward move.
- Downward Momentum: Similarly, if the decrease in the moving average exceeds the "Slope" threshold, the logic identifies this as a confirmed downward move.
Summary for Traders
In practical terms, this script helps you filter out the "chatter" of the market to see the primary trend. It calculates a refined path based on historical price data and then highlights when that path is moving with enough strength (slope) to be considered a significant trend change. It allows you to see not just where the price was, but the current momentum of where the price is going.
//+------------------------------------------------------------------+
//|                     Indicator:           Hull moving average.mq4 |
//|                       Version:                             0.002 |
//|                     Copyright:              Rabbit Traders Group |
//|                        E-mail:       witchazel@kungfurabbits.com |
//|        Modified by Cobraforex for THV System, www.cobraforex.com |
//+------------------------------------------------------------------+
#property copyright "Copyright © 2007, Rabbit Traders Group"
#property link      "www.artattica.net"

#property indicator_chart_window
#property indicator_buffers 3
#property indicator_color1 Yellow
#property indicator_width1 3
#property indicator_color2 FireBrick
#property indicator_width2 3
#property indicator_color3 Green
#property indicator_width3 3

extern int     xPeriod=55;
extern double  xSlope = 2.0;

double HMA[],up[],dn[];

int init()  {

SetIndexStyle(0,DRAW_LINE);
SetIndexBuffer(0,HMA);
SetIndexLabel(0,"HMA " + xPeriod + " , " + xSlope) ;

SetIndexStyle(1,DRAW_LINE);
SetIndexBuffer(1,up);

SetIndexStyle(2,DRAW_LINE);
SetIndexBuffer(2,dn);

return(0);

}

int deinit()  {return(0); }

int start()  {

double sqrt = MathRound ( MathSqrt( xPeriod ) );

for(int i=Bars;i>=0;i--) {
   double sum = 0;
   int wma_sum = 0;
   for(int j=0; j < sqrt; j++) {
      double val = 2*iMA(NULL, 0, MathRound(xPeriod/2), 0, MODE_LWMA, PRICE_MEDIAN, i+j)- iMA(NULL, 0, xPeriod, 0, MODE_LWMA, PRICE_MEDIAN, i+j);
      sum = sum + val*(sqrt-j);
      wma_sum = wma_sum + (sqrt-j);
   }
   HMA[i] = sum/wma_sum;

   if(HMA[i]>HMA[i+1]+xSlope*Point) up[i]=HMA[i];
   if(HMA[i]<HMA[i+1]-xSlope*Point) dn[i]=HMA[i];
}


return(0);

}
Comments