HP Extrapolator
Download script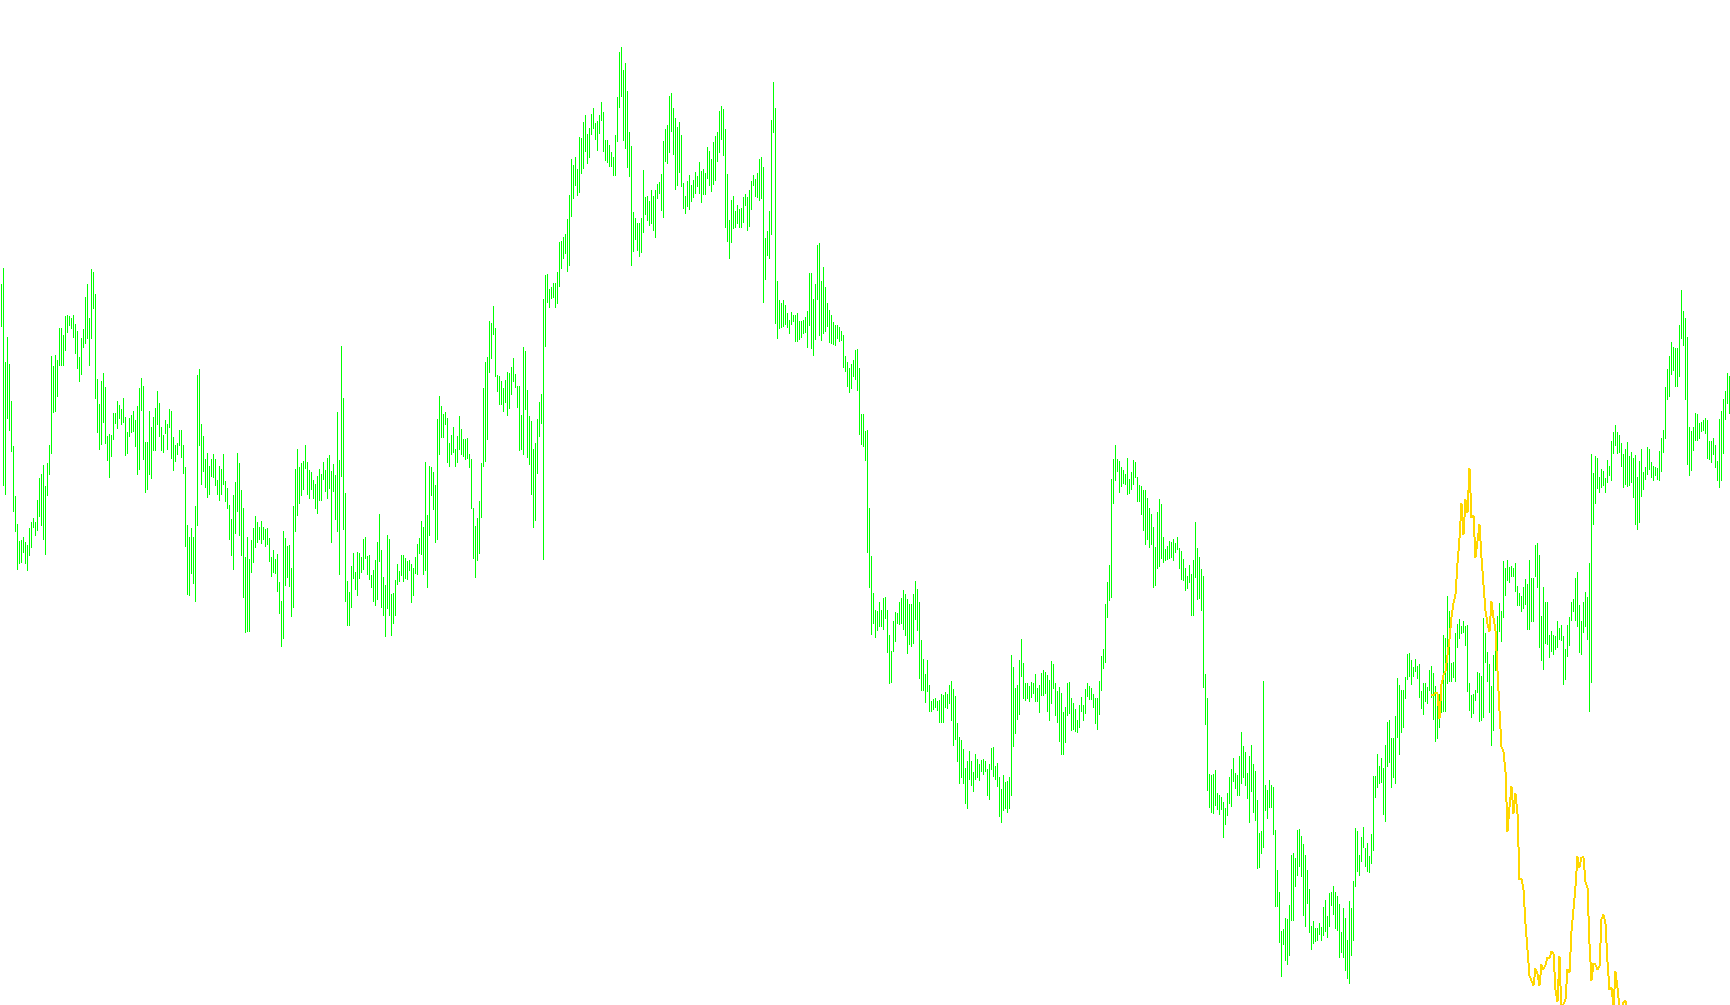
The HP Extrapolator is a specialized technical analysis tool designed to analyze historical price trends and project potential future movements on a trading chart. Unlike standard indicators that simply react to what has already happened, this script utilizes sophisticated mathematical filtering to smooth out "noise" from the market, allowing for a clearer view of underlying trends.
Core Logic and Functionality
The script operates by analyzing a large volume of historical price data to identify significant patterns. It specifically employs the Hodrick-Prescott (HP) Filter, which is a widely recognized method in economics and statistics used to separate a time series into two components: the long-term trend and short-term fluctuations (cycles/noise).
By filtering out these erratic, short-term price swings, the tool focuses on the "true" direction of the market. Once this trend is established, the script attempts to extend that information into the future to provide a visual projection of where prices might head.
Key Operational Methods
The tool offers two distinct ways to process and project these trends, which you can choose based on your preference for sensitivity:
- Method 1 (Conservative): This method relies exclusively on existing historical data. It looks back at past values and applies different filter lengths to calculate the projection. It is designed for users who want a projection rooted strictly in what has already occurred on the chart.
- Method 2 (Dynamic): This approach is more complex as it incorporates both historical data and previously projected values into its calculations. By using a fixed filter length, it attempts to create a smoother transition between the known past and the predicted future.
User Configuration Parameters
To tailor the behavior of the extrapolation, the script provides several adjustable settings:
- Last Bar: Determines how far back from the current price the tool begins its initial analysis.
- Past Bars: Defines the total volume of historical data used to "train" the filter. A larger number allows the tool to see a longer history but may take more processing power.
- Fut Bars: Specifies how many candles into the future the script will attempt to project the trend.
Summary for the Trader
In essence, this script acts as a "trend forecaster." It takes a massive amount of historical data, strips away the distracting market volatility using the Hodrick-Prescott Filter, and draws a projected path showing the anticipated continuation of the current price trend.
//+--------------------------------------------------------------------------------------+
//|                                                                  HP Extrapolator.mq4 |
//|                                                               Copyright © 2008, gpwr |
//|                                                                   vlad1004@yahoo.com |
//+--------------------------------------------------------------------------------------+
#property copyright "Copyright © 2008, gpwr"
#property indicator_chart_window
#property indicator_buffers 1
#property indicator_color1 Red
#property indicator_width1 2

//Global constants
#define pi 3.141592653589793238462643383279502884197169399375105820974944592

//Input parameters
extern int Method   =1;    //Prediction method
//Method 1: use only existing past values and different length filters
//Method 2: use both existing and prediced values with the filter length of 3
extern int LastBar  =150;  //Last bar in the past data
extern int PastBars =10000;//Number of past bars to fit HP filter
extern int FutBars  =100;  //Number of bars to predict

//Indicator buffers
double fv[];

int init()
{
   IndicatorBuffers(1);
   SetIndexBuffer(0,fv);
   SetIndexStyle(0,DRAW_LINE,STYLE_SOLID,2);
   SetIndexShift(0,FutBars-LastBar);
   IndicatorShortName("HP Extrapolator");
   return(0);
}
//+---------------------------------------------------------------------------------------+
int start()
{
   int n;
   double x[],y[];
   ArrayResize(x,PastBars);
   ArrayResize(y,PastBars);
   for(int i=0;i<PastBars;i++) x[i]=Close[i+LastBar];
   ArrayInitialize(fv,EMPTY_VALUE);
   fv[FutBars]=Close[LastBar];
   double sum=Close[LastBar];
   if(Method==2)
   {
      n=2*FutBars+1;
      HPF(PastBars,Lambda(n),x,y);
      for(i=1;i<=n-2;i++) sum+=Close[i+LastBar];
   }
   for(i=1;i<=FutBars;i++)
   {
      if(Method==1)
      {
         n=2*i+1;
         HPF(PastBars,Lambda(n),x,y);
         sum+=Close[i+LastBar];
         fv[FutBars-i]=n*y[0]-sum;
         sum=n*y[0];
      }
      else
      {
         fv[FutBars-i]=n*y[FutBars-i]-sum;
         sum+=fv[FutBars-i]-Close[n-1+LastBar-i];
      }
   }
   return(0);
}
// Hodrick-Prescott Filter----------------------------------------------------------------+
void HPF(int nobs, double lambda, double x[], double& y[])
{
   double a[],b[],c[],H1,H2,H3,H4,H5,HH1,HH2,HH3,HH4,HH5,HB,HC,Z;
   ArrayResize(a,nobs);
   ArrayResize(b,nobs);
   ArrayResize(c,nobs);

   a[0]=1.0+lambda;
   b[0]=-2.0*lambda;
   c[0]=lambda;
   for(int i=1;i<nobs-2;i++)
   {
      a[i]=6.0*lambda+1.0;
      b[i]=-4.0*lambda;
      c[i]=lambda;
   }
   a[1]=5.0*lambda+1;
   a[nobs-1]=1.0+lambda;
   a[nobs-2]=5.0*lambda+1.0;
   b[nobs-2]=-2.0*lambda;
   b[nobs-1]=0.0;
   c[nobs-2]=0.0;
   c[nobs-1]=0.0;

   //Forward
   for(i=0;i<nobs;i++)
   {
      Z=a[i]-H4*H1-HH5*HH2;
      HB=b[i];
      HH1=H1;
      H1=(HB-H4*H2)/Z;
      b[i]=H1;
      HC=c[i];
      HH2=H2;
      H2=HC/Z;
      c[i]=H2;
      a[i]=(x[i]-HH3*HH5-H3*H4)/Z;
      HH3=H3;
      H3=a[i];
      H4=HB-H5*HH1;
      HH5=H5;
      H5=HC;
   }

   //Backward
   H2=0;
   H1=a[nobs-1];
   y[nobs-1]=H1;
   for(i=nobs-2;i>=0;i--)
   {
      y[i]=a[i]-b[i]*H1-c[i]*H2;
      H2=H1;
      H1=y[i];
   }
}
// Lambda for Hodrick-Prescott Filter------------------------------------------------+
double Lambda(int n)
{
   double w; // w=pi*frequency
   if(n<=37)
      switch(n)
      {
         case  2: w=pi/3.0;
         case  3: w=MathArctan(MathSqrt(0.6));
         case  4: w=2.153460564/n;
         case  5: w=1.923796031/n;
         case  6: w=1.915022415/n;
         case  7: w=1.909786299/n;
         case  8: w=1.906409362/n;
         case  9: w=1.904103844/n;
         case 10: w=1.902459533/n;
         case 11: w=1.901245508/n;
         case 12: w=1.900323600/n;
         case 13: w=1.899607018/n;
         case 14: w=1.899038987/n;
         case 15: w=1.898581041/n;
         case 16: w=1.898206498/n;
         case 17: w=1.897896254/n;
         case 18: w=1.897636390/n;
         case 19: w=1.897416484/n;
         case 20: w=1.897228842/n;
         case 21: w=1.897067382/n;
         case 22: w=1.896927473/n;
         case 23: w=1.896805427/n;
         case 24: w=1.896698359/n;
         case 25: w=1.896603866/n;
         case 26: w=1.896520032/n;
         case 27: w=1.896445477/n;
         case 28: w=1.896378692/n;
         case 29: w=1.896318725/n;
         case 30: w=1.896264646/n;
         case 31: w=1.896215693/n;
         case 32: w=1.896171301/n;
         case 33: w=1.896130841/n;
         case 34: w=1.896094060/n;
         case 35: w=1.896060192/n;
         case 36: w=1.896029169/n;
         case 37: w=1.896000584/n;
      }
   else w=1.896/n;
   return(0.0625/MathPow(MathSin(w),4));
}
Comments