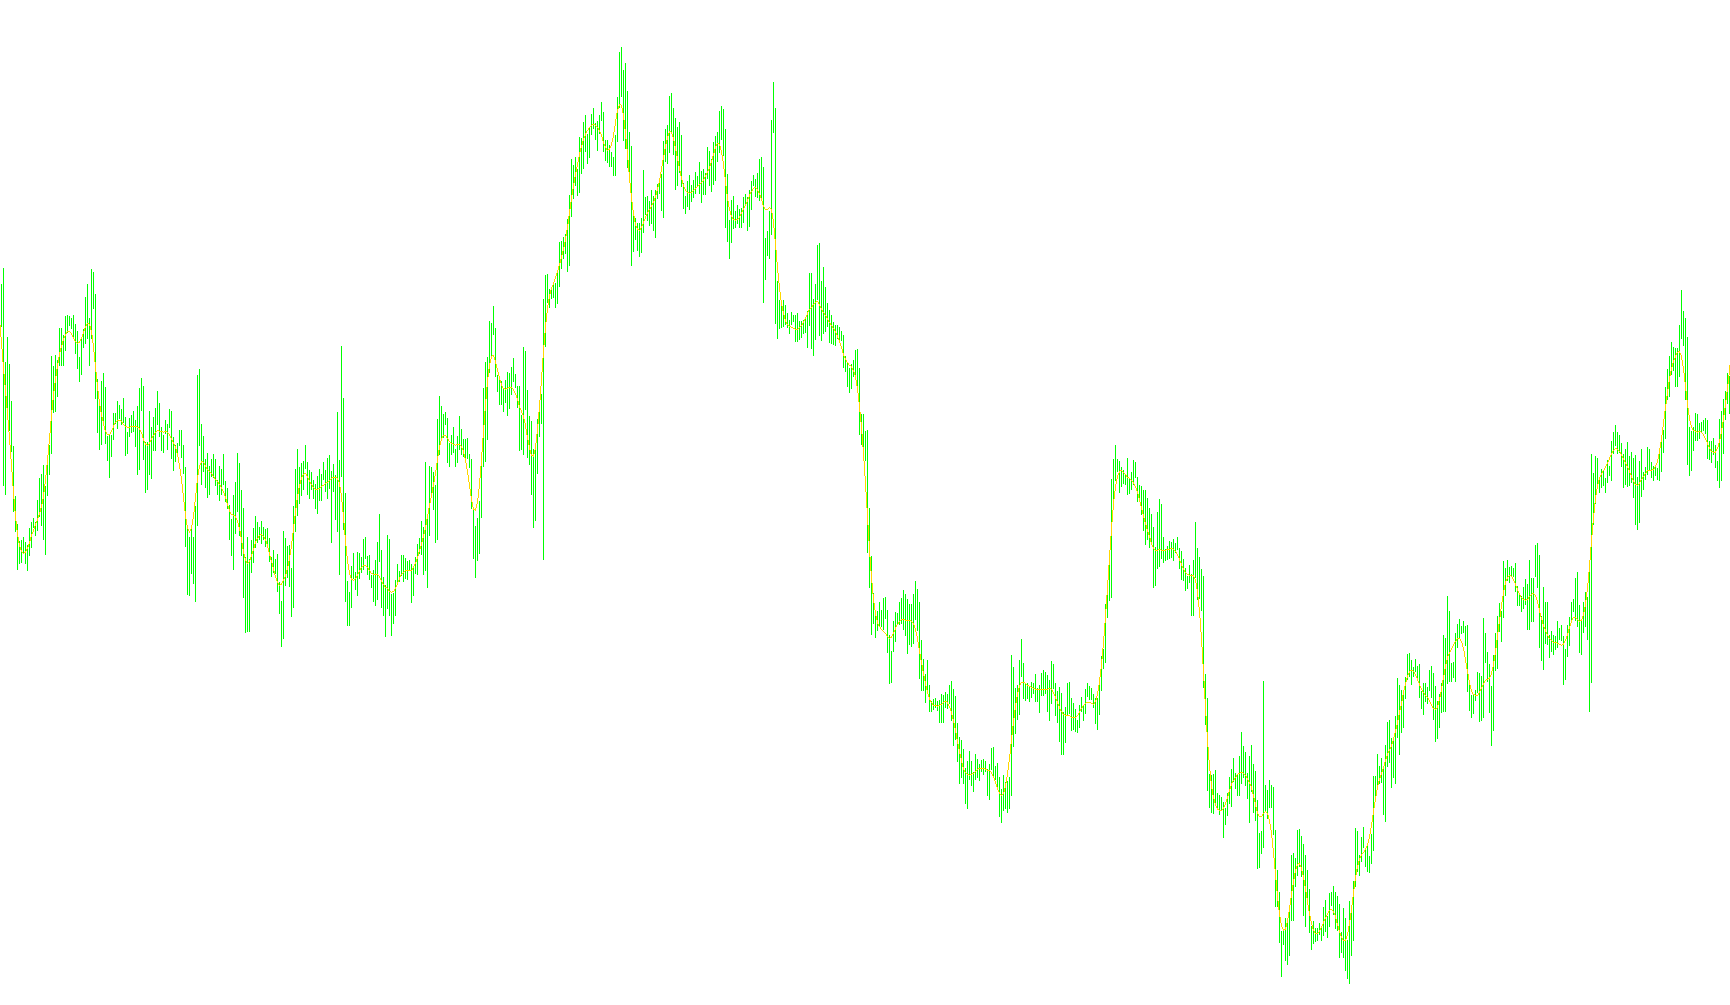
This tool is designed to provide a clearer view of market trends by filtering out "noise"—those small, erratic price fluctuations that can often make it difficult to see the larger direction of the market. It achieves this using a sophisticated mathematical technique known as the Hodrick-Prescott Filter, which is commonly used in economic analysis to separate long-term trends from short-term cycles.
How it Works The script analyzes a large historical dataset of price movements (specifically focusing on closing prices). Instead of simply reacting to every minor tick or momentary spike, the logic processes these prices through two distinct phases:
- Forward Calculation: The tool scans the data chronologically, calculating the underlying weight and influence of each price point based on a specific "smoothing" factor. This helps establish the mathematical framework for what constitutes a meaningful trend versus a temporary fluctuation.
- Backward Refinement: Once the framework is set, the script works backward through the data to finalize the curve. This dual-pass approach ensures that the resulting line represents a balanced, smooth representation of the price history rather than a jagged path.
Key Parameters
- Smoothing Range (Number of Bars): This determines how much historical data the tool looks at when calculating the trend. A larger range allows for a broader perspective on market movement.
- Filter Period: This acts as the "sensitivity" dial. It dictates how aggressively the tool ignores short-term volatility. By adjusting this, you can decide how closely the resulting line should follow the actual price versus how much you want it to smooth out.
Visual Output The final result is a clean, yellow line displayed on your chart. Because this logic identifies the core "trend" of the data, the resulting line provides a visual representation of where the market is headed over time, stripped of the distractions caused by day-to-day volatility. It is essentially a tool for clarity, helping traders distinguish between temporary market "hiccups" and actual structural shifts in price.
//+------------------------------------------------------------------+
//|                                                           HP.mq4 |
//+------------------------------------------------------------------+
#property indicator_chart_window
#property indicator_buffers 1
#property indicator_color1 Yellow

//Global constants
#define pi 3.141592653589793238462643383279502884197169399375105820974944592

//Input parameters
extern int nobs    =100000; //Number of bars to smooth
extern int FiltPer =12;    //Equivalent to SMA period

//Indicator buffers
double hpf[],lambda;

int init()
{
   lambda=0.0625/MathPow(MathSin(pi/FiltPer),4);
   SetIndexBuffer(0,hpf);
   SetIndexStyle(0,DRAW_LINE);
   return(0);
}
//+----------------------------------------------------------------------------------------+
int start()
{
   double x[];
   ArrayResize(x,nobs);
   for(int i=0;i<nobs;i++) x[i]=Close[i];
   HPF(nobs,lambda,x,hpf);
   return(0);
}
// Hodrick-Prescott Filter-----------------------------------------------------------------+
void HPF(int nobs, double lambda, double x[], double& y[])
{
   double a[],b[],c[],H1,H2,H3,H4,H5,HH1,HH2,HH3,HH4,HH5,HB,HC,Z;
   ArrayResize(a,nobs);
   ArrayResize(b,nobs);
   ArrayResize(c,nobs);

   a[0]=1.0+lambda;
   b[0]=-2.0*lambda;
   c[0]=lambda;
   for(int i=1;i<nobs-2;i++)
   {
      a[i]=6.0*lambda+1.0;
      b[i]=-4.0*lambda;
      c[i]=lambda;
   }
   a[1]=5.0*lambda+1;
   a[nobs-1]=1.0+lambda;
   a[nobs-2]=5.0*lambda+1.0;
   b[nobs-2]=-2.0*lambda;
   b[nobs-1]=0.0;
   c[nobs-2]=0.0;
   c[nobs-1]=0.0;

   //Forward
   for(i=0;i<nobs;i++)
   {
      Z=a[i]-H4*H1-HH5*HH2;
      HB=b[i];
      HH1=H1;
      H1=(HB-H4*H2)/Z;
      b[i]=H1;
      HC=c[i];
      HH2=H2;
      H2=HC/Z;
      c[i]=H2;
      a[i]=(x[i]-HH3*HH5-H3*H4)/Z;
      HH3=H3;
      H3=a[i];
      H4=HB-H5*HH1;
      HH5=H5;
      H5=HC;
   }

   //Backward
   H2=0;
   H1=a[nobs-1];
   y[nobs-1]=H1;
   for(i=nobs-2;i>=0;i--)
   {
      y[i]=a[i]-b[i]*H1-c[i]*H2;
      H2=H1;
      H1=y[i];
   }
}
Comments