HMA_Color_v03_v1
Download script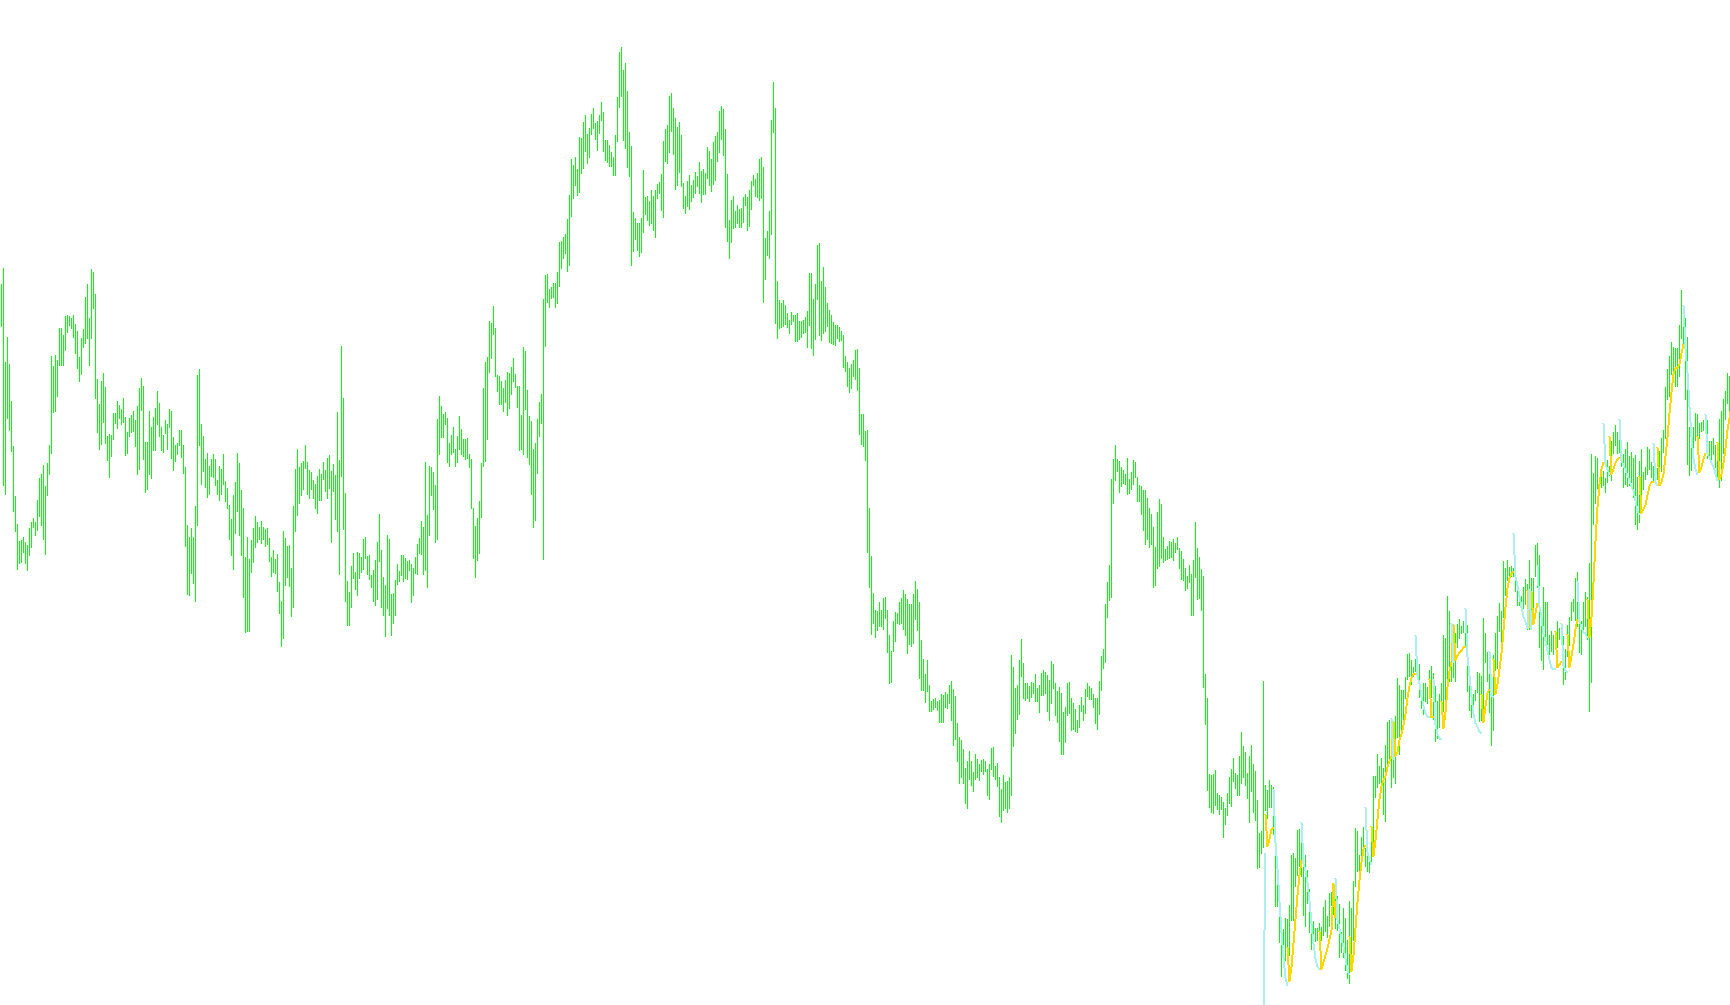
This script functions as a specialized technical analysis tool designed to help traders identify momentum and trend direction by smoothing out market price fluctuations. It utilizes the logic of a Hull Moving Average (HMA), which is known for its ability to balance responsiveness with stability.
Core Logic & Calculation
The tool operates through a multi-layered calculation process:
- Weighted Averaging: Rather than looking at simple averages, the script employs a "Linearly Weighted Moving Average" (LWMA). This places more importance on recent price data while still accounting for historical trends.
- Dual-Speed Comparison: The logic calculates two different weighted averages simultaneously: one based on the full period defined by the user and another based on half of that period. By multiplying the shorter average by two and subtracting the longer average, the tool captures the "velocity" or the immediate change in price action.
- Smoothing Factor: To prevent the indicator from being too erratic or "noisy," the result of that subtraction is smoothed out one final time using a calculation based on the square root of the primary period. This produces a fluid line that tracks price closely without capturing every minor, insignificant tick.
Visual Behavior & Trend Identification
The script is designed to provide clear visual cues regarding the current market direction:
- Dynamic Tracking: The primary output is a moving line that follows the trend of the asset's price.
- Directional Signaling: The logic is programmed to detect when the momentum shifts. It compares the current smoothed value against the previous value to determine if the trend is moving up or down.
- Visual Color Coding: When the trend changes direction, the script assigns specific colors to the line (Lime Green, Yellow, and Red). This allows a trader to see at a glance whether the momentum has switched from bullish to bearish or vice versa, making it easier to identify potential entry or exit points based on shifting sentiment.
User Customization
The tool provides two primary settings to tailor its sensitivity to different trading styles:
- HMA Period: Determines how many bars of data the indicator considers; a higher number makes the line smoother and slower, while a lower number makes it faster and more reactive.
- Bars To Draw: Controls the visual depth of the indicator on the chart.
Indicators Used
Miscellaneous
12
Views
0
Downloads
0
Favorites
HMA_Color_v03_v1
/*-----------------------------+
|			       |
| Shared by www.Aptrafx.com    |
|			       |
+------------------------------*/

//+----------------+
//| HMA.mq4  by Ron|
//+----------------+

/*
MetaStock Formula
period:=Input("Period",1,200,20) ;
sqrtperiod:=Input("Square Root of Period",1,20,4);
Mov(2*(Mov(C,period/2,W))-Mov(C,period,W),sqrtperiod,W);

SuperCharts Formula
Input: period (Default value 20)
waverage(2*waverage(close,period/2)-waverage(close,period), SquareRoot(Period))

Added color on direction change

*/


#property copyright "Ron Thompson"
#property link "http://www.lightpatch.com/forex/"

//---- indicator settings
#property indicator_chart_window
#property indicator_buffers 3

#property indicator_color1 LimeGreen
#property indicator_color2 Yellow
#property indicator_color3 Red

//User input
extern int HMA_Period=14;
extern int BarsToDraw=200;

// display buffers
double ind_buffer0[];
double ind_buffer1[];
double ind_buffer2[];

// computation buffers
double buffer[];


//Custom init
int init()
  {
   IndicatorBuffers(4);

   SetIndexBuffer(0,ind_buffer0) ;
   SetIndexStyle(0,DRAW_LINE,STYLE_SOLID,2);

   SetIndexBuffer(1,ind_buffer1);
   SetIndexStyle(1,DRAW_LINE,STYLE_SOLID,2);

   SetIndexBuffer(2,ind_buffer2);
   SetIndexStyle(2,DRAW_LINE,STYLE_SOLID,2);

   SetIndexBuffer(3, buffer);
  }

//Custom DE-init
int deinit()
  {
  }


// Main Program loop
int start()
  {
   int i;
   int counted_bars=IndicatorCounted();
   double tmp, tmpPrevious;

   double fullMA;
   double halfMA;

   int fullPeriod = HMA_Period;
   int halfPeriod = HMA_Period/2;
   int sqrtPeriod = MathFloor(MathSqrt(HMA_Period*1.00));

   //---- MA difference counted in the 1-st buffer
   for(i=0; i<BarsToDraw; i++)
     {
      halfMA=iMA(NULL,0,halfPeriod,0,MODE_LWMA,PRICE_CLOSE,i)*2;
      fullMA=iMA(NULL,0,fullPeriod,0,MODE_LWMA,PRICE_CLOSE,i);
      buffer[i]=halfMA-fullMA;
     }

   //calculate bar[0]
   tmp=iMAOnArray(buffer,0,MathFloor(MathSqrt(HMA_Period)),0,MODE_LWMA,0);

   for(i=1; i<BarsToDraw; i++)
     {
      tmpPrevious=iMAOnArray(buffer,0,MathFloor(MathSqrt(HMA_Period)),0,MODE_LWMA,i);
      if (tmpPrevious > tmp)
        {
         ind_buffer0[i] = EMPTY_VALUE;
         ind_buffer1[i] = EMPTY_VALUE;
         ind_buffer2[i] = tmpPrevious+0.0005;
         ind_buffer2[i-1] = tmp-0.0005;
        }
       else if (tmpPrevious < tmp)
        {
         ind_buffer0[i] = tmpPrevious+0.0005;
         ind_buffer0[i-1] = tmp-0.0005;
         ind_buffer1[i] = EMPTY_VALUE;
         ind_buffer2[i] = EMPTY_VALUE;
        }
       else
        {
         ind_buffer0[i] = CLR_NONE;
         ind_buffer1[i] = tmpPrevious+0.0005;
         ind_buffer2[i-1] = tmp-0.0005;
         ind_buffer2[i] = CLR_NONE;
        }

      tmp = tmpPrevious;

     }//for
  }
Comments