HistoStepSto_v1
Download script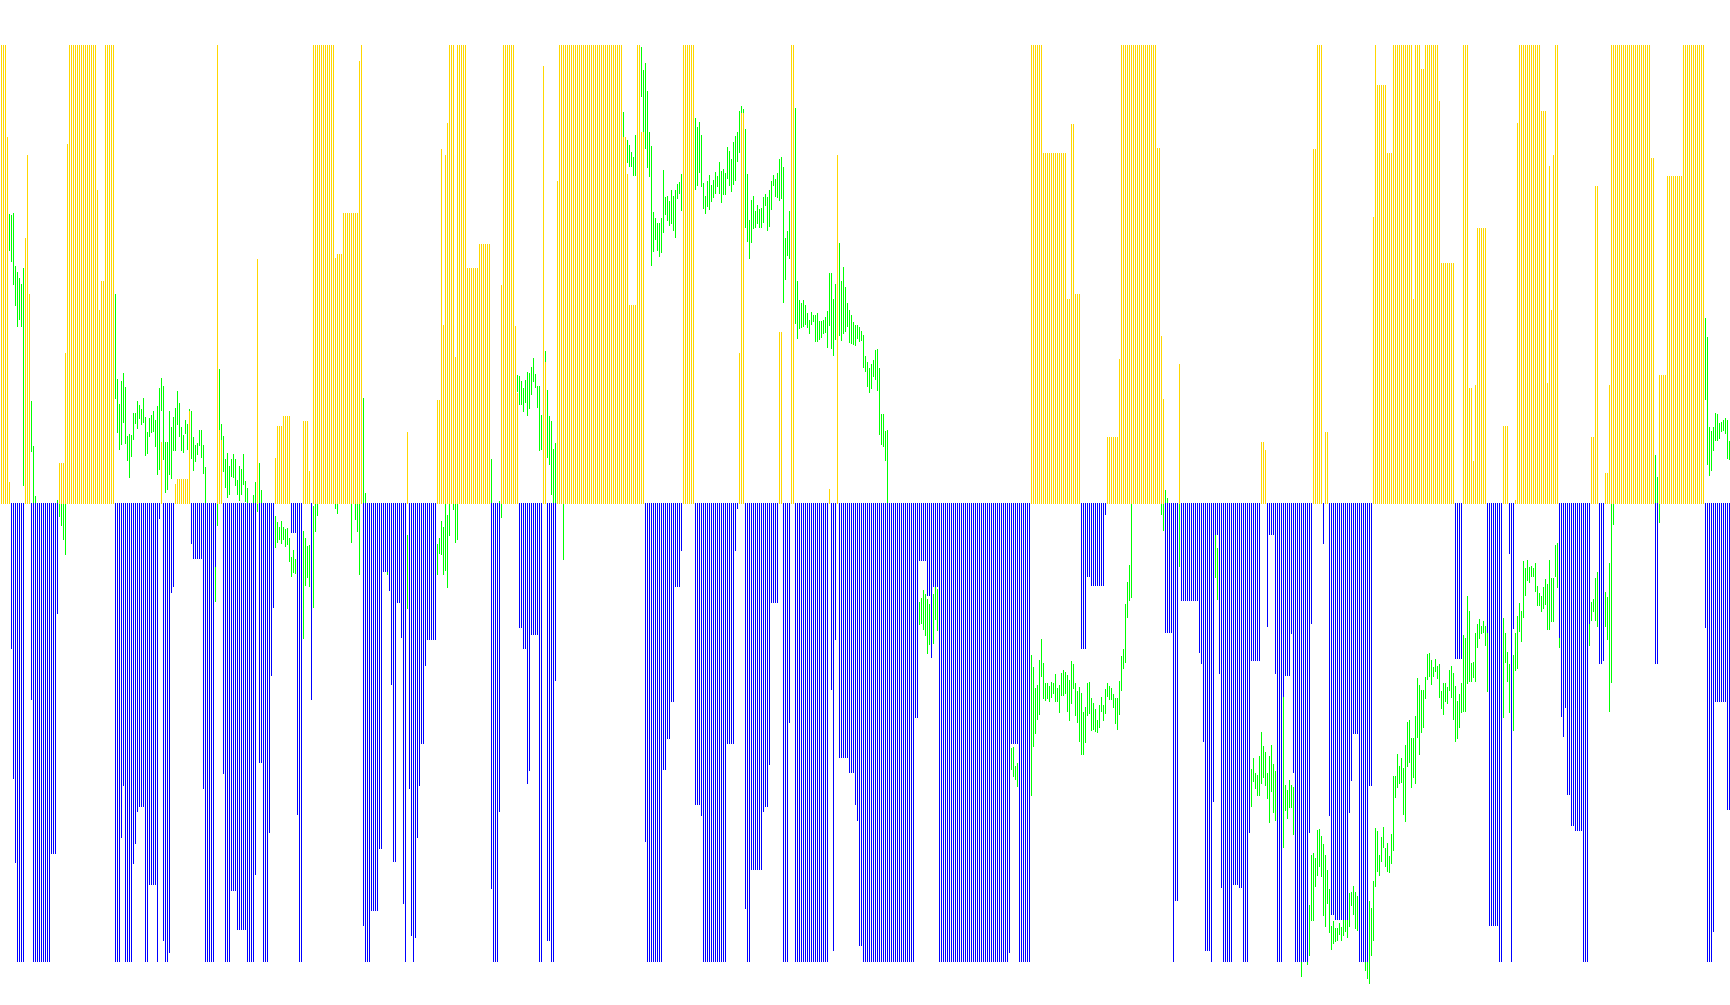
This script functions as a specialized visual indicator designed to help traders identify market trends and momentum by analyzing price action relative to volatility. Unlike standard moving averages that smooth out price, this logic focuses on "steps"—specific price levels that the market must break through to confirm a change in direction.
Core Logic Overview
The indicator works by calculating the current "mood" of the market based on how far the price moves compared to its recent history. It achieves this through several layers of analysis:
1. Volatility Measurement The script first looks at the recent price range (the difference between highs and lows) over a set period. It calculates an Average True Range (ATR). This establishes a baseline for "normal" market movement, allowing the indicator to distinguish between standard noise and significant price shifts.
2. Dynamic Step Calculation Using that volatility data, the script creates three different "step" zones:
- Minimum: A tight zone for high-sensitivity trend detection.
- Maximum: A wider zone to identify major structural moves.
- Mid: A balanced zone used to find equilibrium.
These steps act like boundaries. The script tracks whether the price is breaking above or below these levels. If the price breaks a boundary, the indicator registers a "Trend State."
3. Trend Persistence A key feature of this logic is its "memory." Once a trend direction is identified (e.g., the price breaks a maximum upper step), the script remembers that state until the price fails to maintain it or crosses back over. This prevents the indicator from flickering rapidly when the market is sideways, ensuring that only sustained movements are highlighted.
4. Momentum Filtering The final output is a histogram (visualized as bars) in a separate window. It calculates the difference between a "Fast" momentum line and a "Slow" momentum line:
- If the Fast trend is significantly stronger than the Slow trend (exceeding a specific filter), it paints an upward bar.
- If the Slow trend is significantly stronger, it paints a downward bar.
- If the difference between them is too small, no bar is drawn, which helps "filter out" low-confidence signals where the market lacks clear direction.
Summary for Traders
In practical terms, this script ignores minor price wiggles and waits for the market to move with enough conviction to break through volatility-adjusted boundaries. The resulting histogram provides a visual representation of trend strength: larger bars indicate accelerating momentum, while the absence of bars suggests a consolidating or neutral market.
//+------------------------------------------------------------------+
//|                                              HistoStepSto_v1.mq4 |
//|                                Copyright © 2006, TrendLaboratory |
//|            http://finance.groups.yahoo.com/group/TrendLaboratory |
//|                                   E-mail: igorad2003@yahoo.co.uk |
//|            Thanks to Nikolay Kositsin for good reversal tecnique |
//+------------------------------------------------------------------+
#property copyright "Copyright © 2006, TrendLaboratory"
#property link      "http://finance.groups.yahoo.com/group/TrendLaboratory"

#property indicator_separate_window
#property indicator_buffers 2
#property indicator_color1 DeepSkyBlue
#property indicator_color2 Tomato
#property indicator_width1 3
#property indicator_width2 3
#property indicator_maximum  30
#property indicator_minimum -30

//---- input parameters
extern int     Length      = 10;    // Volty Length
extern double  Kfast       =  1;    // Sensivity Factor for Fast Line
extern double  Kslow       =  1;    // Sensivity Factor for Slow Line
extern int     MA_Mode     =  0;    // Volty MA Mode : 0-SMA, 1-LWMA
extern int     StepSizeMIN =  0;    // Minimum Step Size  (if need)
extern int     StepSizeMAX =  0;    // Maximum Step Size  (if need)
extern double  Filter      =  0;    // Filter value in units
//---- indicator buffers
double UpTrendBuffer[];
double DnTrendBuffer[];
double SminMin[],SmaxMin[],SminMax[],SmaxMax[],SminMid[],SmaxMid[];

int    time[2],TRENDMIN[2],TRENDMID[2],TRENDMAX[2];
bool   Expert=true;
double ATR0,ATRmax=0,ATRmin=100000;
//+------------------------------------------------------------------+
//| Custom indicator initialization function                         |
//+------------------------------------------------------------------+
  int init()
  {
   string short_name;
//---- indicator line
   IndicatorBuffers(8);
   SetIndexStyle(0,DRAW_HISTOGRAM);
   SetIndexStyle(1,DRAW_HISTOGRAM);
   SetIndexBuffer(0,UpTrendBuffer);
   SetIndexBuffer(1,DnTrendBuffer);
   SetIndexBuffer(2,SminMin);
   SetIndexBuffer(3,SmaxMin);
   SetIndexBuffer(4,SminMax);
   SetIndexBuffer(5,SmaxMax);
   SetIndexBuffer(6,SminMid);
   SetIndexBuffer(7,SmaxMid);

//---- name for DataWindow and indicator subwindow label
   short_name="StepSto v2("+DoubleToStr(Kfast,2)+","+DoubleToStr(Kslow,2)+")";
   IndicatorShortName(short_name);
   SetIndexLabel(0,"StepSto UpTrend");
   SetIndexLabel(1,"StepSto DownTrend");
//----
   SetIndexDrawBegin(0,Length);
   SetIndexDrawBegin(1,Length);
//----
   return(0);
  }

//+------------------------------------------------------------------+
//| HistoStepSto_v1                                                       |
//+------------------------------------------------------------------+
int start()
{
   int      shift, TrendMin,TrendMax,TrendMid,MaxBar,limit,counted_bars=IndicatorCounted();

   double   linemin,linemax,linemid,bsmin,bsmax, StoFast, StoSlow;
   double   StepSizeMin, StepSizeMax,StepSizeMid;

   if (Bars-1<Length+1)return(0);
   if (counted_bars<0)return(-1);

   if (counted_bars>0) counted_bars--;

   MaxBar=Bars-1-Length-1;
   limit=Bars-counted_bars-1;

   if (limit>MaxBar)
   {
      for (shift=limit;shift>=MaxBar;shift--)
      {
      UpTrendBuffer[Bars-shift]=0;
      DnTrendBuffer[Bars-shift]=0;
      }
   limit=MaxBar;
   }

	//----
   int Tnew=Time[limit+1];

   if (limit<MaxBar)
      if (Tnew==time[1])
      {
      TrendMin=TRENDMIN[1];
      TrendMid=TRENDMID[1];
      TrendMax=TRENDMAX[1];
      Expert=false;
      }
      else
      if (Tnew==time[0])
      {
      TrendMin=TRENDMIN[0];
      TrendMid=TRENDMID[0];
      TrendMax=TRENDMAX[0];

      TRENDMIN[1]=TRENDMIN[0];
      TRENDMID[1]=TRENDMID[0];
      TRENDMAX[1]=TRENDMAX[0];
      }
   else
   {
   if (Tnew>time[1])Print("ERROR01");
   else Print("ERROR02");
   return(-1);
   }


	for(shift=limit;shift>=0;shift--)
   {

	double AvgRange=0;
	double Weight = 0;
	  for (int i=Length-1;i>=0;i--)
	  {
     if(MA_Mode==0) double alfa= 1.0; else alfa= 1.0*(Length-i)/Length;
     AvgRange+= alfa*(High[shift+i]-Low[shift+i]);
     Weight += alfa;
     }
	  ATR0 = AvgRange/Weight;

	if (ATR0>ATRmax) ATRmax=ATR0;
	if (ATR0<ATRmin) ATRmin=ATR0;

	if (StepSizeMIN > 0) ATRmin = StepSizeMIN*Point;
	if (StepSizeMAX > 0) ATRmax = StepSizeMAX*Point;

	StepSizeMin=(Kfast*ATRmin);
	StepSizeMax=(Kfast*ATRmax);
	StepSizeMid=(Kfast*0.5*Kslow*(ATRmax+ATRmin));

	SmaxMin[shift]=Close[shift]+2.0*StepSizeMin;
	SminMin[shift]=Close[shift]-2.0*StepSizeMin;

	SmaxMax[shift]=Close[shift]+2.0*StepSizeMax;
	SminMax[shift]=Close[shift]-2.0*StepSizeMax;

	SmaxMid[shift]=Close[shift]+2.0*StepSizeMid;
	SminMid[shift]=Close[shift]-2.0*StepSizeMid;

	if(Close[shift]>SmaxMin[shift+1]) TrendMin=1;
	if(Close[shift]<SminMin[shift+1]) TrendMin=-1;

	if(Close[shift]>SmaxMax[shift+1]) TrendMax=1;
	if(Close[shift]<SminMax[shift+1]) TrendMax=-1;

	if(Close[shift]>SmaxMid[shift+1]) TrendMid=1;
	if(Close[shift]<SminMid[shift+1]) TrendMid=-1;


	  if(TrendMin>0)
	  {
	  if(SminMin[shift]<SminMin[shift+1]) SminMin[shift]=SminMin[shift+1];
	  linemin=SminMin[shift]+StepSizeMin;
	  }
	  if(TrendMin<0)
	  {
	  if(SmaxMin[shift]>SmaxMin[shift+1]) SmaxMin[shift]=SmaxMin[shift+1];
	  linemin=SmaxMin[shift]-StepSizeMin;
	  }
	  if(TrendMax>0)
	  {
	  if(SminMax[shift]<SminMax[shift+1]) SminMax[shift]=SminMax[shift+1];
	  linemax=SminMax[shift]+StepSizeMax;
	  }

	  if(TrendMax<0)
	  {
	  if(SmaxMax[shift]>SmaxMax[shift+1]) SmaxMax[shift]=SmaxMax[shift+1];
	  linemax=SmaxMax[shift]-StepSizeMax;
	  }

	  if(TrendMid>0)
	  {
	  if(SminMid[shift]<SminMid[shift+1]) SminMid[shift]=SminMid[shift+1];
	  linemid=SminMid[shift]+StepSizeMid;
	  }

	  if(TrendMid<0)
	  {
	  if(SmaxMid[shift]>SmaxMid[shift+1]) SmaxMid[shift]=SmaxMid[shift+1];
	  linemid=SmaxMid[shift]-StepSizeMid;
	  }

	bsmin=linemax-StepSizeMax;
	bsmax=linemax+StepSizeMax;

	if (bsmax-bsmin>0) StoFast=100*(linemin-bsmin)/(bsmax-bsmin);
	if (bsmax-bsmin>0) StoSlow=100*(linemid-bsmin)/(bsmax-bsmin);

	if (StoFast-StoSlow > Filter)
	{
	UpTrendBuffer[shift] = StoFast-StoSlow;
	DnTrendBuffer[shift] = 0;
	}
	else
	if (StoFast-StoSlow > 0 && StoFast-StoSlow <= Filter)
	{
	UpTrendBuffer[shift] = 0;
	DnTrendBuffer[shift] = 0;
	}

	if (StoSlow-StoFast > Filter)
	{
	DnTrendBuffer[shift] = StoFast-StoSlow;
	UpTrendBuffer[shift] = 0;
	}
	else
	if (StoSlow-StoFast>0 && StoSlow-StoFast <= Filter)
	{
	DnTrendBuffer[shift] = 0;
	UpTrendBuffer[shift] = 0;
	}

	  if ((shift==2)||((shift==1)&&(Expert==true)))
      {
      time [shift-1]=Time [shift];

      TRENDMIN[shift-1]=TrendMin;
      TRENDMID[shift-1]=TrendMid;
      TRENDMAX[shift-1]=TrendMax;
      }
   }
	return(0);
}
Comments