HistoBands
Download script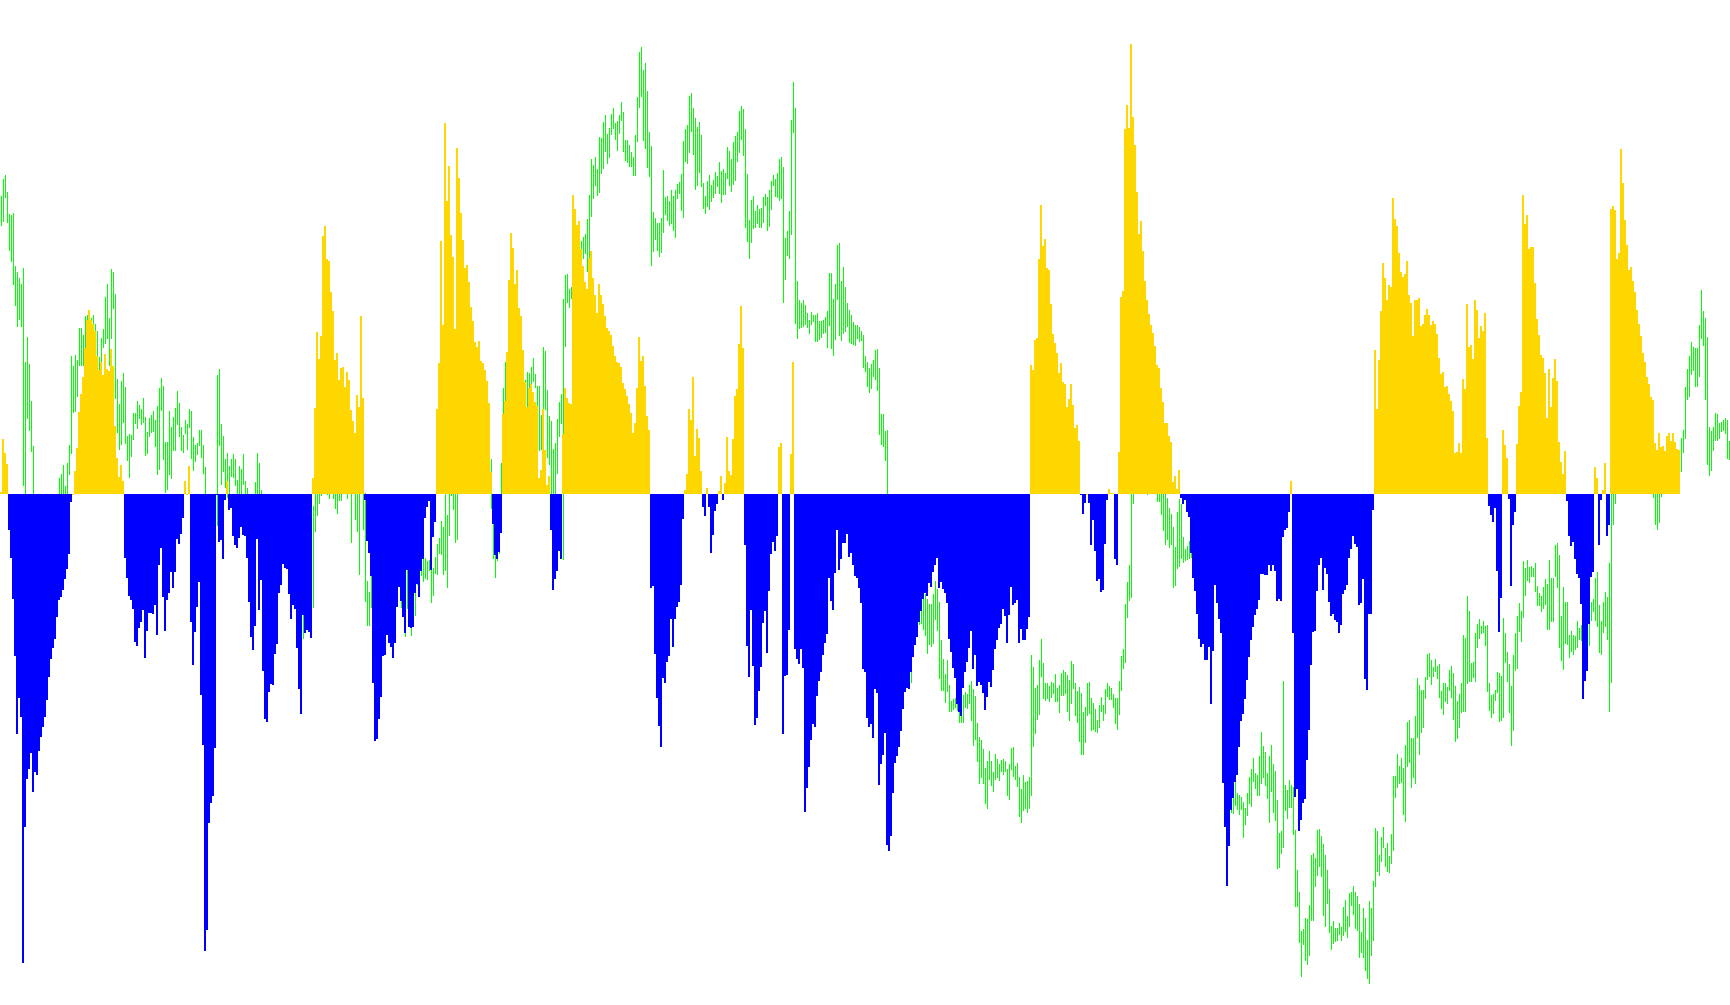
This tool is designed to analyze price movements by creating a visual representation of volatility and momentum trends in a separate window below your main trading chart. Instead of looking at raw prices, it processes data into a specialized histogram that helps identify significant shifts in market behavior.
Core Logic and Workflow
The script operates through a three-step mathematical process to filter out market "noise" and highlight meaningful price action:
1. Establishing the Base Price (Weighting) The tool begins by looking at a specific number of recent candles (defined by the Short Period setting). It identifies the highest high and the lowest low within that timeframe, then combines these with the most recent closing price. By averaging these three components, the script creates a weighted "base" value. This serves as the foundation for all subsequent calculations.
2. Statistical Analysis (Moving Average & Standard Deviation) Once the base values are established, the tool performs two types of statistical analysis:
- Smoothing: It calculates a Simple Moving Average of those base values. This helps identify the general direction of the trend by smoothing out erratic minor fluctuations.
- Volatility Measurement: It calculates the Standard Deviation, which measures how much the price is fluctuating away from its average. This is crucial for determining whether a move is "normal" or an unusual spike in activity.
3. Band Calculation and Visual Display The final step involves comparing the current weighted price against the moving average and the standard deviation to calculate a "Band" value.
- If the calculated movement is positive (upward momentum), it is represented by one color (DodgerBlue).
- If the calculated movement is negative (downward momentum), it is represented by another color (Red).
Summary for the Trader
Essentially, this script acts as a filter. It takes raw market data, smoothes it out to see the true trend, measures how volatile that trend is, and then converts that information into a visual histogram. This allows you to see the "strength" of price movements more clearly, distinguishing between standard market behavior and significant directional momentum.
//+------------------------------------------------------------------+
//|                                                   HistoBands.mq4 |
//|                      Copyright © 2006, MetaQuotes Software Corp. |
//|                                        http://www.metaquotes.net |
//+------------------------------------------------------------------+
#property copyright "Copyright © 2006, MetaQuotes Software Corp."
#property link      "http://www.metaquotes.net"

#property indicator_separate_window
#property indicator_buffers 2
#property indicator_color1 DodgerBlue
#property indicator_color2 Red

double WBP[];
extern int ShortPeriod=5;
//---- buffers
double ExtMapBuffer1[];
double ExtMapBuffer2[];
//+------------------------------------------------------------------+
//| Custom indicator initialization function                         |
//+------------------------------------------------------------------+
int init()
  {
//---- indicators
   IndicatorBuffers(3);
   SetIndexStyle(0,DRAW_HISTOGRAM,0,2);
   SetIndexBuffer(0,ExtMapBuffer1);
   SetIndexStyle(1,DRAW_HISTOGRAM,0,2);
   SetIndexBuffer(1,ExtMapBuffer2);
   SetIndexBuffer(2, WBP);
//----
   return(0);
  }
//+------------------------------------------------------------------+
//| Custor indicator deinitialization function                       |
//+------------------------------------------------------------------+
int deinit()
  {
//----

//----
   return(0);
  }
//+------------------------------------------------------------------+
//| Custom indicator iteration function                              |
//+------------------------------------------------------------------+
int start()
  {
   int    i,k,counted_bars=IndicatorCounted();
   double HH,LL,WBPma,Stdev,Bands;

   if(Bars<=32) return(0);

//---- last counted bar will be recounted
   int limit=Bars-counted_bars;
   if(counted_bars>0) limit++;

   for(i=0; i<limit-1; i++)
   {
      HH=High[Highest(NULL,0,MODE_HIGH,ShortPeriod,i)];
      LL=Low[Lowest(NULL,0,MODE_LOW,ShortPeriod,i)];
      WBP[i]=(HH+LL+Close[i])/3;
   }

   for(i=0; i<limit; i++)
   {
      WBPma=iMAOnArray(WBP,Bars,34,0,MODE_SMA,i);
      Stdev=iStdDevOnArray(WBP,Bars,34,MODE_SMA,0,i);
      Bands=((WBP[i]+2*Stdev-WBPma)/(4*Stdev))*4-2;
      ExtMapBuffer1[i]=0;
      ExtMapBuffer2[i]=0;
      if (Bands>0){ExtMapBuffer1[i]=Bands;}
      if (Bands<0){ExtMapBuffer2[i]=Bands;}
   }

   return(0);
  }
//+------------------------------------------------------------------+
Comments