Hi-Lo_006
Download script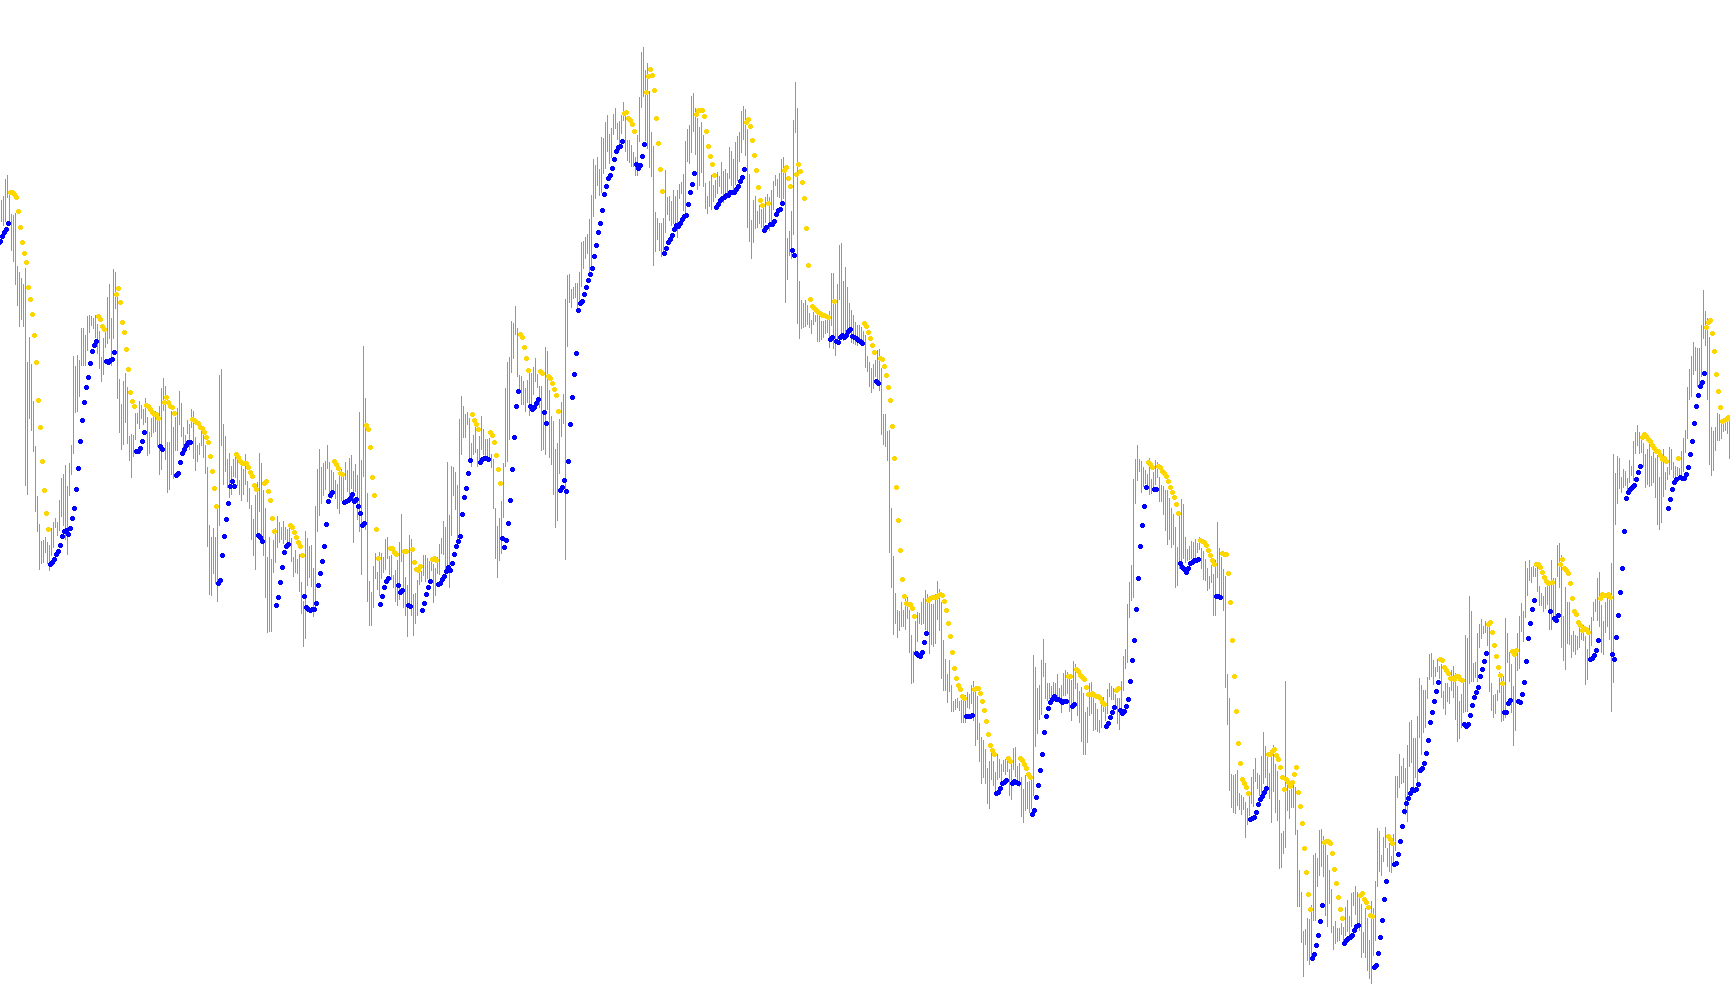
This technical indicator is designed to assist traders by identifying potential shifts in market momentum and price direction through the use of specific price thresholds. Rather than following every minor fluctuation in the market, the logic focuses on establishing distinct "boundaries" based on recent price history.
How the Logic Works
The script functions by analyzing two specific moving averages: one that tracks the High prices and another that tracks the Low prices over a set period of time (determined by the user). These act as dynamic ceilings and floors for the market activity.
The core logic follows these steps:
- Threshold Identification: The tool constantly monitors the relationship between the current closing price and these high/low boundaries.
- Momentum Switching: The indicator looks for "breakouts." A signal is generated when the price moves from being below a specific threshold to above it, or vice versa. This helps filter out market "noise" by only highlighting instances where the price successfully breaches its recent range.
- Visual Signaling: Instead of drawing continuous lines, the tool places specific visual markers (arrows) on the chart. These markers appear when the price dynamics flip:
- One type of marker highlights a shift toward upward momentum.
- The other type highlights a shift toward downward momentum.
Key Objectives for the User
The primary goal of this script is to simplify price action. By focusing on these specific breaches of high and low points, it aims to provide a clearer view of where the trend might be changing. It serves as a visual aid for traders who want to identify potential entry or exit points based on whether the market is currently "breaking out" of its recent boundaries or retreating from them.
//+------------------------------------------------------------------+
//|                                                        Hi-Lo.mq4 |
//|                                                                  |
//|                                        Ramdass - Conversion only |
//+------------------------------------------------------------------+

#property indicator_chart_window
#property indicator_buffers 3
#property indicator_color1 Red
#property indicator_color2 Aqua
//---- input parameters
extern int Per=6;
extern int CountBars=1500;
extern int MA=0;

//---- buffers
double Up[];
double Down[];
//+------------------------------------------------------------------+
//| Custom indicator initialization function                         |
//+------------------------------------------------------------------+
int init()
  {

//---- indicator line
   IndicatorBuffers(2);
   SetIndexStyle(0,DRAW_ARROW);
   SetIndexArrow(0,159);
   SetIndexStyle(1,DRAW_ARROW);
   SetIndexArrow(1,159);
   SetIndexBuffer(0,Up);
   SetIndexBuffer(1,Down);
//----
//----
   return(0);
  }
//+------------------------------------------------------------------+
//| Hi-Lo                                                         |
//+------------------------------------------------------------------+
int start()
  {
   SetIndexDrawBegin(0,Bars-CountBars+Per);
   SetIndexDrawBegin(1,Bars-CountBars+Per);
   int i,counted_bars=IndicatorCounted();
   bool Pr=false, PrevPr=false;
   double val,val2;
//----
   if(CountBars<=Per) return(0);
//---- initial zero
   if(counted_bars<1)
   {
      for(i=1;i<=Per;i++) Up[CountBars-i]=0.0;
      for(i=1;i<=Per;i++) Down[CountBars-i]=0.0;
   }
//----
   i=CountBars-Per-1;
//   if(counted_bars>=CCIPeriod1) i=Bars-counted_bars-1;
   while(i>=0)
     {
      val=iMA(NULL,0,Per,1,MA,PRICE_HIGH,i);
      val2=iMA(NULL,0,Per,1,MA,PRICE_LOW,i);

if (Close[i]<val2 && PrevPr==true) Pr=false;
if (Close[i]>val && PrevPr==false) Pr=true;
PrevPr=Pr;
Up[i]=0.0; Down[i]=0.0;
if (Pr==false) Up[i] = val+3*Point;
if (Pr==true) Down[i] = val2-3*Point;

      i--;
     }
   return(0);
  }
//+------------------------------------------------------------------+
Comments