Fourier_extrapolator
Download script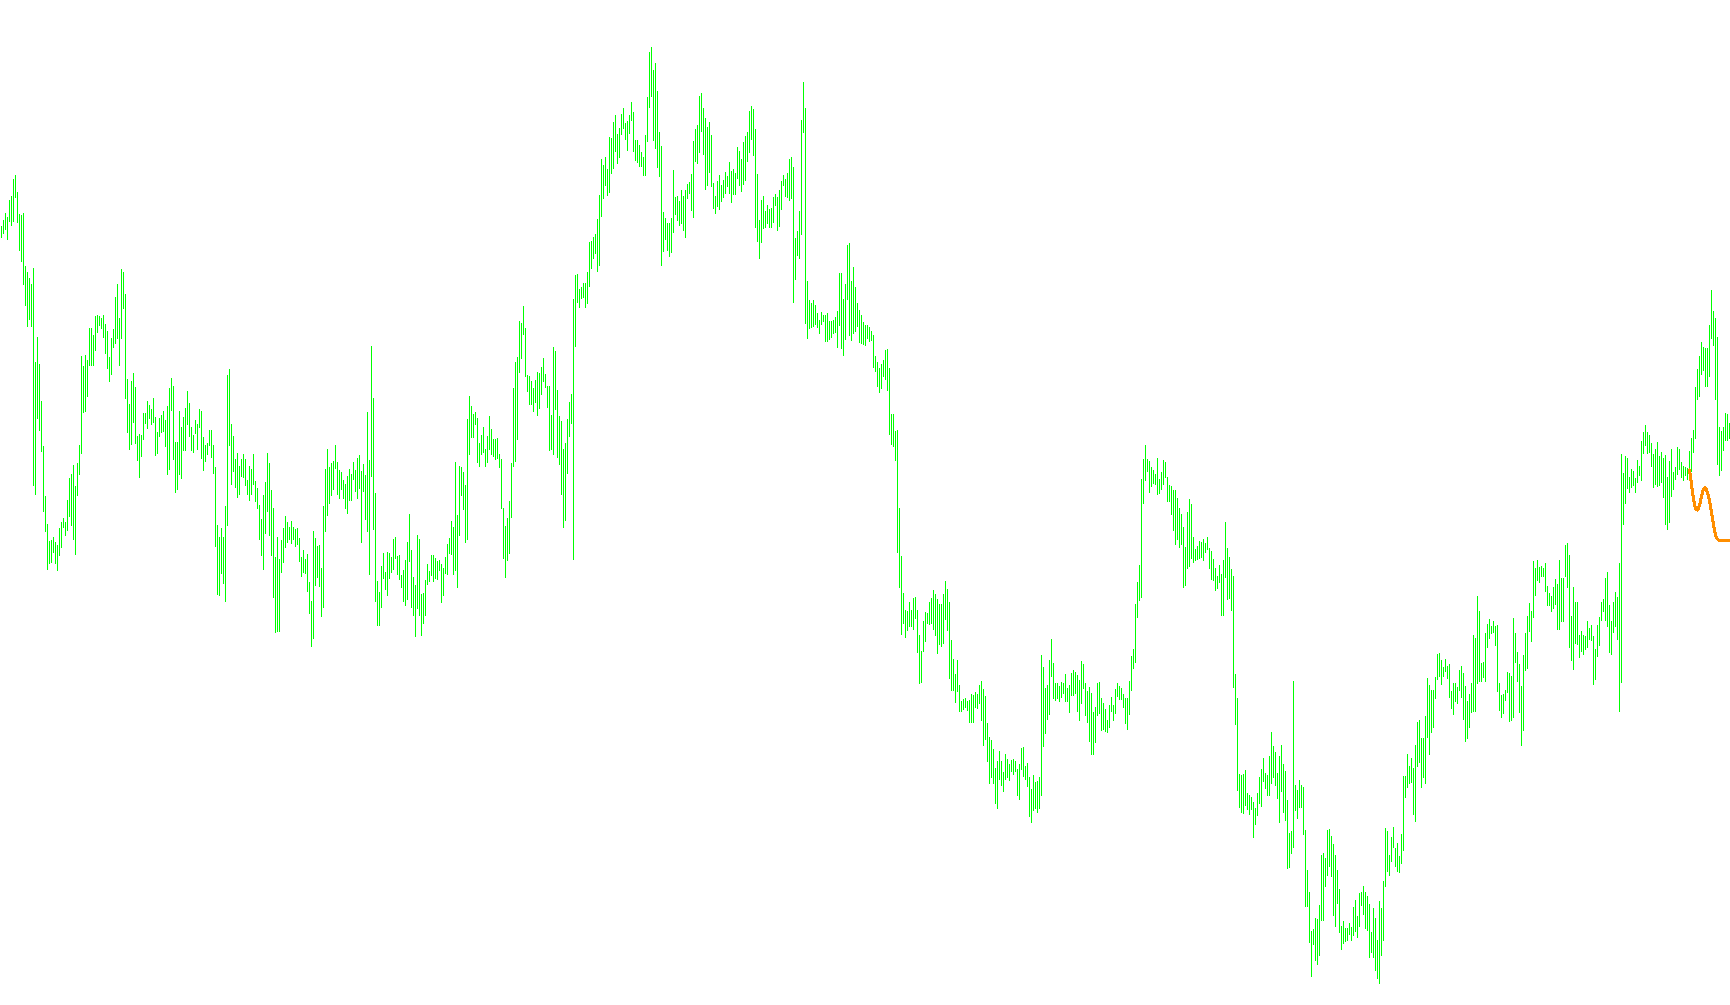
This script is a specialized technical analysis tool designed to analyze and forecast price movements by identifying underlying mathematical cycles in market data. Rather than relying on simple momentum or volume, it uses advanced signal processing techniques to "deconstruct" price history into its fundamental rhythmic components.
Core Logic and Methodology
The logic operates through three primary stages: linear decomposition, spectral analysis, and cycle extrapolation.
1. Trend Baseline Establishment (Linear Regression) Before analyzing cycles, the script first identifies the overarching trend of the data. It uses a method called Linear Regression to calculate a "best-fit" straight line for the price history. This allows the tool to separate the steady long-term direction (the trend) from the short-term fluctuations (the cycles). By removing the trend, the script can focus purely on the repetitive patterns that remain.
2. Frequency Identification (Fourier Analysis) The heart of the script lies in its use of Fourier principles. It treats price movements like a complex sound wave composed of many different notes played simultaneously. The script scans the data to identify these "notes" or frequencies. Specifically, it looks for the most dominant recurring cycle within a user-defined window of time. It calculates the strength and characteristics of these cycles to determine which ones have the most influence on current price action.
3. Predictive Extrapolation Once the dominant cycle is identified, the script projects it forward. It reconstructs the expected price path by combining three elements:
- The established long-term trend.
- The recurring rhythmic cycle found during analysis.
- A dynamic adjustment factor that aligns the forecast with the most recent real-time price data.
Visual Features and Outputs
The script provides several visual layers to help the user interpret the data:
- Trend Visualization: It maps out the predicted path, showing where the price is mathematically "supposed" to go based on the identified cycles.
- Cycle Detection: The tool includes an automated logic that detects when a new cycle begins. When it recognizes a shift in the dominant frequency, it can trigger alerts to notify the user of a potential transition in market behavior.
- Profit Tracking: A specific feature of this script is its ability to calculate potential profit based on the forecast. It calculates the difference between projected price points and actual historical prices to provide a visual representation of the tool's accuracy.
- Dynamic Alignment: The script continuously adjusts its calculations to ensure that the mathematical model remains synchronized with the current market "live" price, minimizing the gap between theory and reality.
Summary for the User
In essence, this tool acts as a mathematical "prism." It takes messy, volatile price movements and breaks them down into their basic rhythmic parts. By identifying which cycle is currently driving the market, it attempts to draw a roadmap of where that cycle will lead next, helping traders distinguish between temporary noise and recurring structural patterns.
//+------------------------------------------------------------------+
//|                               Fourier_extrapolator_4th_cycle.mq4 |
//|                                    Ïîääóáíûé Îëåã aka neoclassic |
//|                             Àâòîð ôóíêöèé af_FT, af_LR - ANG3100 |
//+------------------------------------------------------------------+
#property copyright "Ïîääóáíûé Îëåã"

#property indicator_chart_window
#property indicator_buffers 8

extern int T=1000;
extern int shift=0;
extern bool showprofit=true;
extern bool alert=false;

int Tmin=20;
int bars=0;
int flagdrow=1;
int Ti;
int TLR;

double aa,bb,w;
double pi=3.1415926535897932384626433832795;
double ak0,ak[],bk[],spectr[],prognoz[];
double profit[];

int deinit()
  {

  ObjectDelete("time_line");
  ObjectDelete("price_line");

   return(0);
  }

int start()
  {

if ((T+shift)>Bars) T=Bars-shift;
if (shift==0) showprofit=false;


if (bars==0)
{

SetIndexStyle(0,DRAW_LINE,STYLE_SOLID,3,DarkOrange);
SetIndexBuffer(0, prognoz);
SetIndexStyle(1,DRAW_NONE);
SetIndexBuffer(1, ak);
SetIndexStyle(2,DRAW_NONE);
SetIndexBuffer(2, bk);
SetIndexStyle(3,DRAW_NONE);
SetIndexBuffer(3, spectr);
SetIndexStyle(4,DRAW_LINE,STYLE_SOLID,1,DodgerBlue);
SetIndexBuffer(4,profit);

int count=0;

double h3[],ak3[],bk3[],aabuf[],bbbuf[],ak0buf[]; int Tbuf[];

ArrayInitialize(prognoz,EMPTY_VALUE);


ArrayResize(h3,T/3);
ArrayResize(ak3,T/3);
ArrayResize(bk3,T/3);
ArrayResize(aabuf,T/3);
ArrayResize(bbbuf,T/3);
ArrayResize(ak0buf,T/3);
ArrayResize(Tbuf,T/3);

ArrayInitialize(h3,0.0);
ArrayInitialize(ak3,0.0);
ArrayInitialize(bk3,0.0);
ArrayInitialize(aabuf,0.0);
ArrayInitialize(bbbuf,0.0);
ArrayInitialize(ak0buf,0.0);
ArrayInitialize(Tbuf,0.0);


while (T>=Tmin)
{
   ArrayInitialize(ak,EMPTY_VALUE);
   ArrayInitialize(bk,EMPTY_VALUE);
   ArrayInitialize(spectr,0.0);
   SetIndexShift(0,TLR-shift);
   SetIndexShift(4,TLR-shift);


   Ti=T+1;
   af_LR(Ti,shift);
   w=2*pi/Ti;
   af_FT(Ti,shift);

   for (int i=2;i<6;i++) {spectr[i]=MathPow(ak[i]*ak[i]+bk[i]*bk[i],0.5)/2;}

   if (ArrayMaximum(spectr)==3)
   {
      h3[count]=spectr[3];
      ak3[count]=ak[3];
      bk3[count]=bk[3];
      Tbuf[count]=T;
      if (flagdrow==1) {aabuf[count]=aa; bbbuf[count]=bb; ak0buf[count]=ak0;}
      count++;

   }

   if (ArrayMaximum(spectr)!=3 && count!=0)
   {

      count=0;
      int amax=ArrayMaximum(h3);
      w=2*pi/(Tbuf[amax]+1);

      if (flagdrow==0)
      {
         if (alert==true) Alert(Tbuf[amax]/3);

         for (i=Tbuf[amax]/3; i>=0; i--)
         {
            prognoz[TLR-Tbuf[amax]/3+i]+=ak3[amax]*MathCos(3*i*w)+bk3[amax]*MathSin(3*i*w)
                                        -ak3[amax]*MathCos(Tbuf[amax]*w)-bk3[amax]*MathSin(Tbuf[amax]*w);

         }
         ArrayInitialize(h3,0.0);
         ArrayInitialize(ak3,0.0);
         ArrayInitialize(bk3,0.0);
         ArrayInitialize(Tbuf,0.0);
      }

      if (flagdrow==1)
      {
         if (alert==true) { Alert("---- start new cycle ----");Alert(Tbuf[amax]/3);}

         for (i=Tbuf[amax]/3; i>=0; i--)
         {
            prognoz[i]=0.0;
            prognoz[i]+=ak3[amax]*MathCos(3*i*w)+bk3[amax]*MathSin(3*i*w);
            prognoz[i]+=bbbuf[amax]+aabuf[amax]*(i-Tbuf[amax]/3)+ak0buf[amax];
         }
         flagdrow=0;
         TLR=Tbuf[amax]/3;

         ArrayInitialize(h3,0.0);
         ArrayInitialize(ak3,0.0);
         ArrayInitialize(bk3,0.0);
         ArrayInitialize(Tbuf,0.0);
      }
   }

T--;
}

double delta=Close[shift]-prognoz[TLR];
for (i=TLR;i>=0;i--) {prognoz[i]+=delta;}


//*********Ðàññ÷åò ìàññèâà ïðèáûëè profit[]******************************

if (showprofit==true)
{

   for (i=TLR-1; i>=0; i--)
   {
      double i1=prognoz[i];
      double i2=prognoz[i-1];

      profit[TLR]=Close[shift];

      double tlri=TLR-i;

      if (shift>=tlri)
      {
         if (i1>i2)
         {
            profit[i]=profit[i+1]+Open[shift-TLR+i]-Close[shift-TLR+i];
         }

         if (i1<i2)
         {
            profit[i]=profit[i+1]-Open[shift-TLR+i]+Close[shift-TLR+i];
         }

         if (i1==i2)
         {
            profit[i]=profit[i+1];
         }

      }
   }

   int prlnt; if (TLR>=shift) {prlnt=0;} else {prlnt=shift-TLR;}

   ObjectCreate("price_line",OBJ_TREND,0,Time[shift],Close[shift],Time[prlnt],Close[shift]);
   ObjectSet("price_line",OBJPROP_RAY,false);
   ObjectSet("price_line",OBJPROP_COLOR,DodgerBlue);
   ObjectCreate("time_line",OBJ_VLINE,0,Time[shift],0);
   ObjectSet("time_line",OBJPROP_STYLE,2);
   ObjectSet("time_line",OBJPROP_COLOR,DarkOrange);

}
//**********************************************************************

bars=Bars;
}
return(0);
}


//*******************************************************************
void af_FT(int T,int i0)
{
   int i,k;
   double sum_cos,sum_sin,dci;

   ak0=0.0;
   for (i=0; i<T; i++) ak0+=Close[i+i0]-bb-aa*i;
   ak0=ak0/T;

   for (k=1; k<=6; k++)
   {
      sum_cos=0.0;
      sum_sin=0.0;
      for (i=0; i<T; i++)
      {
         dci=Close[i+i0]-bb-aa*i;
         sum_cos+=dci*MathCos(k*i*w);
         sum_sin+=dci*MathSin(k*i*w);
      }
      ak[k]=sum_cos*2/T;
      bk[k]=sum_sin*2/T;
   }
}

//*******************************************************************
void af_LR(int p,int i) // af_LR(Ti,i0)
{
   double sx=0,sy=0,sxy=0,sxx=0;

   if (p<2) p=2;
   for (int n=0; n<p; n++)
   {
      sx+=n;
      sy+=Close[n+i];
      sxy+=n*Close[n+i];
      sxx+=n*n;
   }
   aa=(sx*sy-p*sxy)/(sx*sx-p*sxx);
   bb=(sy-aa*sx)/p;
}
Comments