ForexOFFTrend2_v1
Download script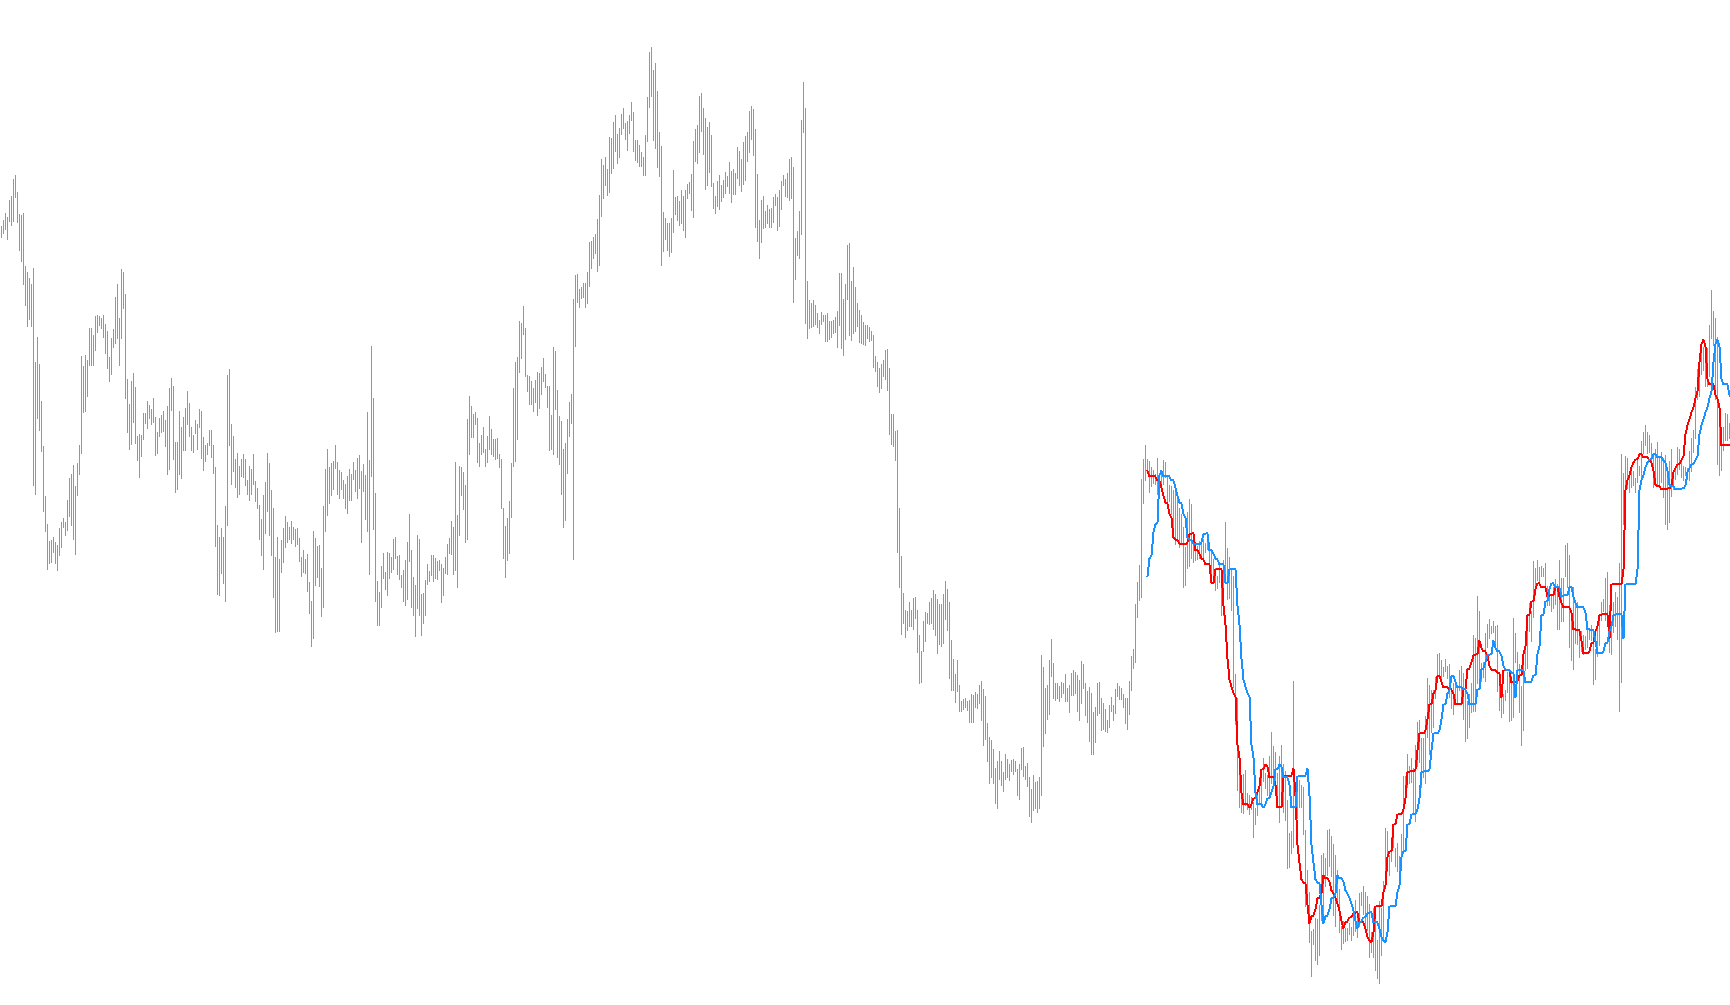
The SilverTrend indicator is a visual technical analysis tool designed to help traders identify potential trend directions and momentum shifts on a financial chart. Rather than focusing on simple price movements, it analyzes price extremes over a specific window of time to provide smoothed directional signals.
Core Operational Logic
The script functions by continuously scanning a historical look-back period (defined by the user) to calculate significant price boundaries. Here is a breakdown of how it processes data:
- Price Range Analysis: The indicator looks at a set number of recent bars to identify the highest peak (Highest High) and the lowest valley (Lowest Low). This establishes the "trading range" for that specific timeframe.
- Dynamic Boundary Calculation: Instead of just plotting the high and low prices directly, the logic applies a percentage-based calculation to these extremes. It determines specific upper and lower thresholds based on a user-defined range. By calculating these boundaries, the script attempts to filter out "market noise" and focus on the broader structure of the price movement.
- Trend Tracking: The tool utilizes two distinct data streams (represented as Red and DodgerBlue lines). These lines track the calculated boundaries as they evolve across the chart.
Visual Signals and Interpretation
The primary objective of this logic is to provide a clear visual cue regarding market sentiment:
- Bullish Context (Buy): When the calculations suggest that the current price momentum is favoring an upward move, the indicator generates a "buy" signal. This occurs when one trend line moves significantly above the other in a specific sequence.
- Bearish Context (Sell): Conversely, when the data indicates downward pressure, the indicator signals a "sell" opportunity by showing a shift in the relationship between the two trend lines.
Key Summary for Users
Essentially, SilverTrend acts as a filter. It takes volatile price action, identifies the boundaries of recent price movements, and plots two moving lines that react to those boundaries. When these lines cross or diverge in specific ways, they serve as visual markers to help traders decide whether the current trend is moving toward an increase (Buy) or a decrease (Sell).
/*-----------------------------+
|			       |
| Shared by www.Aptrafx.com    |
|			       |
+------------------------------*/

//+------------------------------------------------------------------+
//|                                                 SilverTrend .mq4 |
//|                             SilverTrend  rewritten by CrazyChart |
//|                                                 http://viac.ru/  |
//+------------------------------------------------------------------+
#property copyright "SilverTrend  rewritten by CrazyChart"
#property link      "http://viac.ru/ "

#property indicator_chart_window
#property indicator_buffers 2
#property indicator_color1 Red
#property indicator_color2 DodgerBlue
//---- input parameters

extern int       CountBars=300;
extern int       SSP=7;
extern double    Kmin=1.6;
extern double    Kmax=50.6; //24 21.6 21.6


//---- buffers
double ExtMapBuffer1[];
double ExtMapBuffer2[];
//+------------------------------------------------------------------+
//| Custom indicator initialization function                         |
//+------------------------------------------------------------------+
int init()
  {
//---- indicators
   IndicatorBuffers(2);
   SetIndexStyle(0,DRAW_LINE,0,2,Red);
   SetIndexBuffer(0,ExtMapBuffer1);
   SetIndexStyle(1,DRAW_LINE,0,2,DodgerBlue);
   SetIndexBuffer(1,ExtMapBuffer2);


//----
   return(0);
  }
//+------------------------------------------------------------------+
//| Custor indicator deinitialization function                       |
//+------------------------------------------------------------------+
int deinit()
  {

   return(0);
  }
//+------------------------------------------------------------------+
//| Custom indicator iteration function                              |
//+------------------------------------------------------------------+
int start()
  {

  if (CountBars>=Bars) CountBars=Bars;
   SetIndexDrawBegin(0,Bars-CountBars+SSP);
   SetIndexDrawBegin(1,Bars-CountBars+SSP);
  int i, i2,loopbegin,counted_bars=IndicatorCounted();
  double SsMax, SsMin, K, val1, val2, smin, smax, price;

  if(Bars<=SSP+1) return(0);
  //---- initial zero

//K=33-RISK;

/*
if (firstTime==true)   {
   loopbegin = CountBars;
   if (loopbegin>(Bars-2*SSP+1)) loopbegin=Bars-2*SSP+1;
   firstTime=False;
}; ðóäèìåíò ñòàðîé ïðîãðàììû
*/
  if(Bars<=SSP+1) return(0);
//---- initial zero

//+++++++
if(counted_bars<SSP+1)
   {
      for(i=1;i<=SSP;i++) ExtMapBuffer1[CountBars-i]=0.0;
      for(i=1;i<=SSP;i++) ExtMapBuffer2[CountBars-i]=0.0;
   }
//+++++++-SSP


for(i=CountBars-SSP;i>=0;i--) {


  SsMax = High[Highest(NULL,0,MODE_HIGH,SSP,i-SSP+1)];
  SsMin = Low[Lowest(NULL,0,MODE_LOW,SSP,i-SSP+1)];
   smin = SsMin-(SsMax-SsMin)*Kmin/100;
   smax = SsMax-(SsMax-SsMin)*Kmax/100;
   ExtMapBuffer1[i-SSP+6]=smax;
   ExtMapBuffer2[i-SSP-1]=smax;
   val1 = ExtMapBuffer1[0];
   val2 = ExtMapBuffer2[0];
if (val1 > val2) Comment("ïîêóïêà buy ",val1);

if (val1 < val2) Comment("ïðîäàæà sell ",val2);


}


//----
   return(0);
  }
//+------------------------------------------------------------------+
Comments