ForexOFFTrend
Download script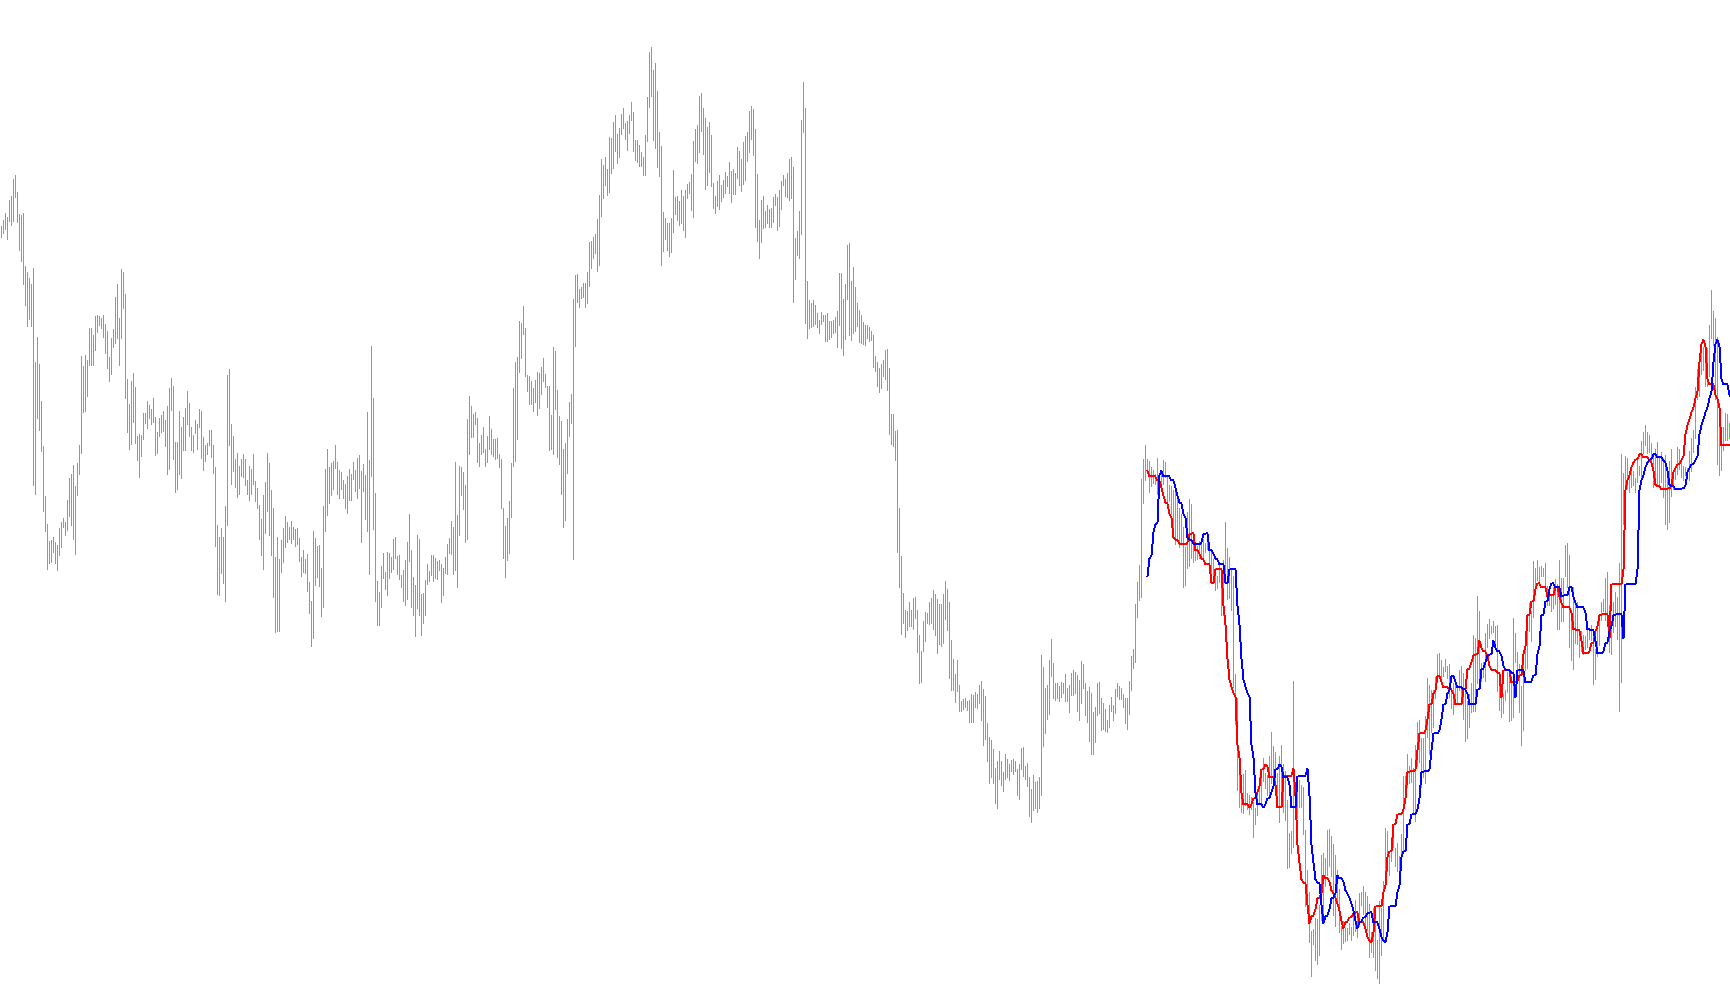
The SilverTrend indicator is designed to assist traders in identifying potential market momentum and trend direction by analyzing price action extremes over a specific period. Instead of following every minor price fluctuation, the logic focuses on establishing significant boundaries based on historical high and low values.
Core Logic & Methodology
The script operates by scanning a designated number of recent bars (user-adjustable) to identify the "territory" where the price has been trading. It follows these primary steps:
- Range Identification: The tool looks back at a set window of candles to find the highest peak and the lowest valley. This establishes the volatility range for that specific timeframe.
- Dynamic Boundary Calculation: Using these extremes, the script calculates two distinct price levels (represented by the red and blue lines on your chart). These levels are derived from the distance between the high and low points using specific percentage-based multipliers.
- Trend Visualization:
- The indicator plots these boundaries as dynamic lines.
- By comparing the relationship between these two calculated values, the script helps visualize whether the current price action is favoring an upward or downward bias.
How it Signals for Traders
The logic provides immediate feedback on the chart to help with decision-making:
- Buy Sentiment: When the primary calculation (represented by the first buffer) rises above the secondary value, the script identifies a potential "Buy" scenario. This suggests that the upward momentum is currently stronger than the downward resistance.
- Sell Sentiment: Conversely, when the primary value falls below the secondary value, it identifies a "Sell" scenario. This indicates that downward pressure is becoming the dominant force in the current market structure.
User Experience Features
- Visual Clarity: The indicator uses distinct colors (Red and Blue) to differentiate between the data streams, making it easy to see trend shifts at a glance.
- On-Screen Feedback: Beyond just drawing lines, the script provides real-time text comments directly on the chart window, explicitly stating "Buy" or "Sell" along with the corresponding value, allowing for quick execution without manual interpretation of the lines.
- Customizable Sensitivity: Users can adjust the "CountBars" (how much history to look at) and the "Kmin/Kmax" parameters, which allow you to tune the indicator's sensitivity—making it more responsive to fast markets or more stable for long-term trending environments.
Miscellaneous
13
Views
0
Downloads
0
Favorites
ForexOFFTrend
/*-----------------------------+
|			       |
| Shared by www.Aptrafx.com    |
|			       |
+------------------------------*/

//+------------------------------------------------------------------+
//|                                                 SilverTrend .mq4 |
//|                             SilverTrend  rewritten by CrazyChart |
//|                                                 http://viac.ru/  |
//+------------------------------------------------------------------+
#property copyright "SilverTrend  rewritten by CrazyChart"
#property link      "http://viac.ru/ "

#property indicator_chart_window
#property indicator_buffers 2
#property indicator_color1 Red
#property indicator_color2 Blue
//---- input parameters

extern int       CountBars=300;
extern int       SSP=7;
extern double    Kmin=1.6;
extern double    Kmax=50.6; //24 21.6 21.6


//---- buffers
double ExtMapBuffer1[];
double ExtMapBuffer2[];
//+------------------------------------------------------------------+
//| Custom indicator initialization function                         |
//+------------------------------------------------------------------+
int init()
  {
//---- indicators
   IndicatorBuffers(2);
   SetIndexStyle(0,DRAW_LINE,0,2,Red);
   SetIndexBuffer(0,ExtMapBuffer1);
   SetIndexStyle(1,DRAW_LINE,0,2,Blue);
   SetIndexBuffer(1,ExtMapBuffer2);


//----
   return(0);
  }
//+------------------------------------------------------------------+
//| Custor indicator deinitialization function                       |
//+------------------------------------------------------------------+
int deinit()
  {

   return(0);
  }
//+------------------------------------------------------------------+
//| Custom indicator iteration function                              |
//+------------------------------------------------------------------+
int start()
  {

  if (CountBars>=Bars) CountBars=Bars;
   SetIndexDrawBegin(0,Bars-CountBars+SSP);
   SetIndexDrawBegin(1,Bars-CountBars+SSP);
  int i, i2,loopbegin,counted_bars=IndicatorCounted();
  double SsMax, SsMin, K, val1, val2, smin, smax, price;

  if(Bars<=SSP+1) return(0);
  //---- initial zero

//K=33-RISK;

/*
if (firstTime==true)   {
   loopbegin = CountBars;
   if (loopbegin>(Bars-2*SSP+1)) loopbegin=Bars-2*SSP+1;
   firstTime=False;
}; ðóäèìåíò ñòàðîé ïðîãðàììû
*/
  if(Bars<=SSP+1) return(0);
//---- initial zero

//+++++++
if(counted_bars<SSP+1)
   {
      for(i=1;i<=SSP;i++) ExtMapBuffer1[CountBars-i]=0.0;
      for(i=1;i<=SSP;i++) ExtMapBuffer2[CountBars-i]=0.0;
   }
//+++++++-SSP


for(i=CountBars-SSP;i>=0;i--) {


  SsMax = High[Highest(NULL,0,MODE_HIGH,SSP,i-SSP+1)];
  SsMin = Low[Lowest(NULL,0,MODE_LOW,SSP,i-SSP+1)];
   smin = SsMin-(SsMax-SsMin)*Kmin/100;
   smax = SsMax-(SsMax-SsMin)*Kmax/100;
   ExtMapBuffer1[i-SSP+6]=smax;
   ExtMapBuffer2[i-SSP-1]=smax;
   val1 = ExtMapBuffer1[0];
   val2 = ExtMapBuffer2[0];
if (val1 > val2) Comment("ïîêóïêà buy ",val1);

if (val1 < val2) Comment("ïðîäàæà sell ",val2);


}


//----
   return(0);
  }
//+------------------------------------------------------------------+
Comments