FF Tunnel Chart
Download script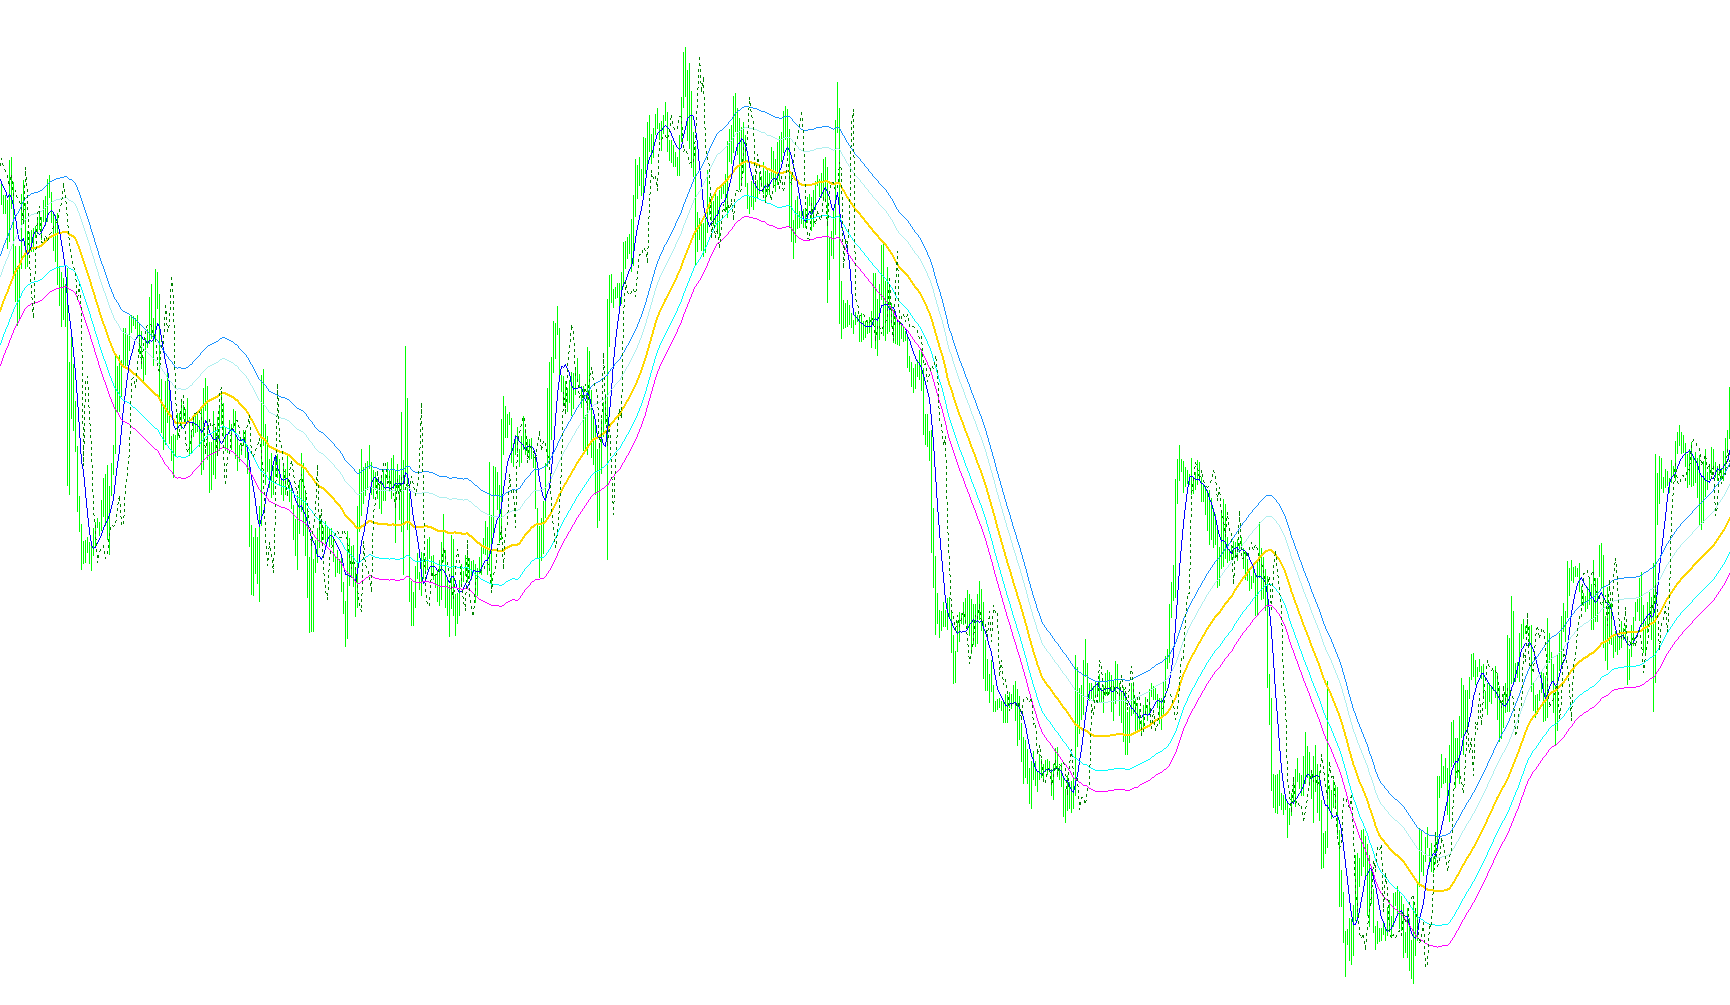
This script is designed as a technical analysis tool for the MetaTrader platform, intended to help traders visualize market trends, identify potential entry/exit zones, and receive real-time alerts based on specific price actions. It functions primarily by calculating moving averages and "tunnel" boundaries to provide a structured view of market momentum.
Core Visual Components
The tool projects several different types of lines onto the trading chart:
- Moving Averages: It tracks two primary averages—a long-term 55-period Simple Moving Average (SMA) and a shorter-term 8-period SMA. These help in identifying the general "flow" of the market.
- The Tunnel: Based on your selection of a "Risk Model," the script calculates four specific boundary lines above and below the main 55-period average. These act as a "tunnel" or corridor, defining zones of high interest for traders depending on their personal risk tolerance.
- Slope Change: It monitors specific price points to identify shifts in the market's trajectory.
Key Functionalities
Risk Model Customization The script allows you to choose between three different risk profiles (Models 1, 2, and 3). Each model adjusts the width of the "tunnel" boundaries. By switching models, you can determine whether you want to trade in tighter, more aggressive corridors or wider, more conservative zones.
Trend Analysis & Filtering The logic performs a multi-layered analysis to help filter out "noisy" market data:
- Weekly Direction: The script automatically looks at the Weekly chart to calculate the difference between two moving averages. It then provides a text update on your screen indicating whether the long-term weekly trend is currently pointing Up or Down.
- Trading Warnings: It includes a built-in safety check. If the price is too close to the main moving average (within a specific threshold), the script will display a warning message on the chart, suggesting that it may be safer to wait until the price moves further away from the average before entering a trade.
Real-Time Alerts and Dashboard To keep the trader informed without needing to constantly watch every tick of the market, the script provides:
- On-Screen Dashboard: A text summary is displayed directly on the chart showing the current weekly direction, the specific risk model being used, the active "Tunnel" prices, and any relevant trading warnings.
- Visual Alerts: The script monitors for specific price actions (specifically when the current price hits a "Slope Change" point) and triggers a visual pop-up alert to notify you of the movement instantly.
In summary, this tool acts as a comprehensive navigation system for your charts, combining multi-timeframe trend analysis with customizable risk boundaries and automated alerts to help filter out uncertainty.
//+------------------------------------------------------------------+
//|                                                    FF Tunnel.mq4 |
//|                                                         FFwithFX |
//|                                                                  |
//+------------------------------------------------------------------+
#property copyright "Financial Freedom with Forex"
#property link      ""

#property indicator_chart_window
#property indicator_buffers 8
#property indicator_color1 Magenta
#property indicator_color2 Red
#property indicator_color3 Silver
#property indicator_color4 Silver
#property indicator_color5 Silver
#property indicator_color6 Silver
#property indicator_color7 Blue
#property indicator_color8 Silver
//---- input parameters
extern bool      AudioAlerts=true;
extern bool      VisualAlerts=true;
extern int       RiskModel=1;

//---- buffers
double ExtMapBuffer1[]; // 55 SMA Median
double ExtMapBuffer2[]; // 8 SMA Close
double ExtMapBuffer3[]; // 1st FibLine up
double ExtMapBuffer4[]; // 2nd FibLine up
double ExtMapBuffer5[]; // 1st FibLine down
double ExtMapBuffer6[]; // 2nd FibLine down
double ExtMapBuffer7[]; // Turning Line
double ExtMapBuffer8[];
//+------------------------------------------------------------------+
//| Custom indicator initialization function                         |
//+------------------------------------------------------------------+
int init()
  {
//---- indicators
   SetIndexStyle(0,DRAW_LINE,STYLE_SOLID,2);
   SetIndexBuffer(0,ExtMapBuffer1);
   SetIndexLabel(0,"55 SMA");
   SetIndexStyle(1,DRAW_LINE);
   SetIndexBuffer(1,ExtMapBuffer2);
   SetIndexLabel(1,"8 SMA");
   SetIndexStyle(2,DRAW_LINE);
   SetIndexBuffer(2,ExtMapBuffer3);
   SetIndexStyle(3,DRAW_LINE);
   SetIndexBuffer(3,ExtMapBuffer4);
   SetIndexStyle(4,DRAW_LINE);
   SetIndexBuffer(4,ExtMapBuffer5);
   SetIndexStyle(5,DRAW_LINE);
   SetIndexBuffer(5,ExtMapBuffer6);
   SetIndexStyle(6,DRAW_LINE,STYLE_DOT,1,Green);
   SetIndexBuffer(6,ExtMapBuffer7);
   SetIndexLabel(6,"Slope Change");
   SetIndexStyle(7,DRAW_LINE);
   SetIndexBuffer(7,ExtMapBuffer8);
//----
   return(0);
  }
//+------------------------------------------------------------------+
//| Custor indicator deinitialization function                       |
//+------------------------------------------------------------------+
int deinit()
  {
//----

//----
   return(0);
  }
//+------------------------------------------------------------------+
//| Custom indicator iteration function                              |
//+------------------------------------------------------------------+
int start()
  {
   int limit;
   int    counted_bars=IndicatorCounted();

   double curr_EMA21;
   double curr_SMA5;
   double prev_EMA21;
   double prev_SMA5;
   double WDiff;
   string Direction;
   string Filter;
  //---- check for possible errors
   if(counted_bars<0) return(-1);
  //---- last counted bar will be recounted
   if(counted_bars>0) counted_bars--;
   limit=Bars-counted_bars;
  //---- main loop
     for(int i=0; i<limit; i++)
       {
        //---- ma_shift set to 0 because SetIndexShift called abowe
         ExtMapBuffer1[i]=iMA(NULL,0,55,0,MODE_SMA,PRICE_MEDIAN,i);
         ExtMapBuffer2[i]=iMA(NULL,0,8,0,MODE_SMA,PRICE_CLOSE,i);
         ExtMapBuffer7[i]=Close[i+8];
         Filter = "OK to Trade";


         //Model #1 89,144,233
         if(RiskModel==1)
         {
            ExtMapBuffer3[i]=ExtMapBuffer1[i]+89*Point;
            ExtMapBuffer4[i]=ExtMapBuffer1[i]+144*Point;

            ExtMapBuffer5[i]=ExtMapBuffer1[i]-89*Point;
            ExtMapBuffer6[i]=ExtMapBuffer1[i]-144*Point;
         }

          //Model #2 144,233,377
         if(RiskModel==2)
         {
            ExtMapBuffer3[i]=ExtMapBuffer1[i]+144*Point;
            ExtMapBuffer4[i]=ExtMapBuffer1[i]+233*Point;

            ExtMapBuffer5[i]=ExtMapBuffer1[i]-144*Point;
            ExtMapBuffer6[i]=ExtMapBuffer1[i]-233*Point;
         }

          //Model #3 233,377,610
         if(RiskModel==3)
         {
            ExtMapBuffer3[i]=ExtMapBuffer1[i]+233*Point;
            ExtMapBuffer4[i]=ExtMapBuffer1[i]+377*Point;

            ExtMapBuffer5[i]=ExtMapBuffer1[i]-233*Point;
            ExtMapBuffer6[i]=ExtMapBuffer1[i]-377*Point;
         }
       }
//---- Calculate the different weekly data
         curr_EMA21=iMA(NULL,PERIOD_W1,21,0,MODE_EMA,PRICE_MEDIAN,0);
         curr_SMA5=iMA(NULL,PERIOD_W1,5,0,MODE_SMA,PRICE_MEDIAN,0);
         prev_EMA21=iMA(NULL,PERIOD_W1,21,0,MODE_EMA,PRICE_MEDIAN,1);
         prev_SMA5=iMA(NULL,PERIOD_W1,5,0,MODE_SMA,PRICE_MEDIAN,1);
         WDiff=((curr_SMA5-curr_EMA21) - (prev_SMA5-prev_EMA21));
         if (WDiff > 0.0) Direction = "^^ UP ^^";
         if (WDiff < 0.0) Direction = "vv DOWN vv";
//       }

// Check for FILTER conditions
         if (MathAbs(ExtMapBuffer1[0]-ExtMapBuffer2[0]) < 50*Point) {
         Filter = StringConcatenate("WARNING: Only trade if Price > ",MathMin(ExtMapBuffer1[0],ExtMapBuffer2[0])+50*Point,
         " or < ",MathMax(ExtMapBuffer1[0],ExtMapBuffer2[0])-50*Point);
         }


         Comment("4Hr Tunnel Weekly Direction : ",Direction,"\n",Filter,
         "\nRISK MODEL #",RiskModel," (0-3)\nSlope Change : ",ExtMapBuffer7[0],
         "\n","\nMA+2 : ",ExtMapBuffer4[0],"\nMA+1 : ",ExtMapBuffer3[0],
         "\nSMA55 : ",ExtMapBuffer1[0],
         "\nMA-1 : ",ExtMapBuffer5[0],"\nMA-2 : ",ExtMapBuffer6[0]);
//       }

       //+--------------------------------------------------------------------------+
       //-                          ALERTS    PlaySound("alert.wav");               -
       //+--------------------------------------------------------------------------+
//      if(AudioAlerts)
//      {
//         if(Close[i]>ExtMapBuffer7[0] || Close[i]<ExtMapBuffer7[0])
//         {
//            PlaySound("alert.wav");
//         }
//      }
//
      if(VisualAlerts)
      {
         if(Close[0]==ExtMapBuffer7[0] || Close[0]==ExtMapBuffer7[0])
         {
           Alert(Symbol()," ", Period(), "min Slope Change - ",Close[0],
            "\n Time: ", TimeToStr(CurTime(),TIME_DATE|TIME_SECONDS),"\n",Filter);
         }
      }

  //---- done

//----

//----
   return(0);
  }
//+------------------------------------------------------------------+
Comments