Ergodic_v2
Download script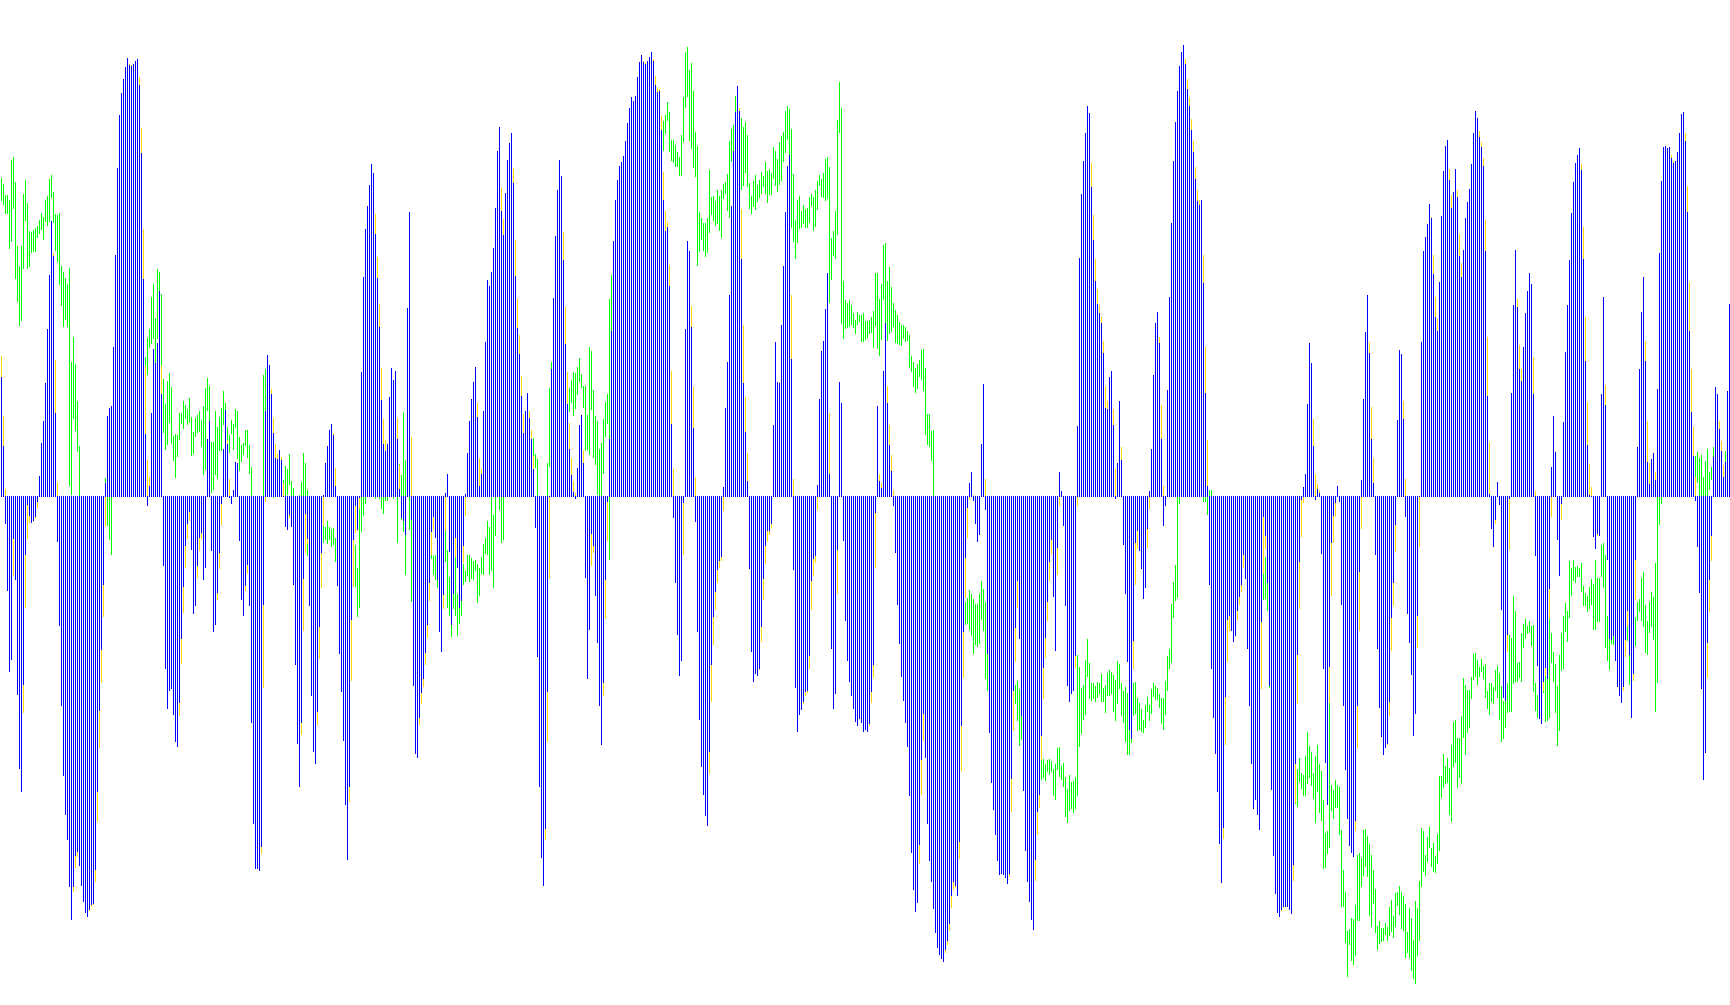
This tool, titled "Ergodic," is designed to provide traders with a visual representation of market momentum and price behavior. It functions by analyzing the relationship between price changes and volatility over time, distilling complex market movements into a simplified histogram.
How the Logic Works
The script processes market data through several layers of calculation to arrive at its final visual output:
1. Establishing Price Deviations The tool starts by looking at the average price (a combination of the high, low, and closing prices) across two different points in time. By calculating the difference between these two points, it determines the "Price Delta"—essentially measuring how much the price has moved forward or backward. It also calculates the absolute value of this movement to understand the magnitude of the change, regardless of direction.
2. Trend Smoothing (Moving Averages) Raw price data can be very "noisy" and erratic. To make the data more readable, the script applies two successive layers of Exponential Moving Averages (EMA).
- The first layer smooths out the immediate Price Delta.
- The second layer smooths the results of that first calculation. This multi-layered smoothing helps filter out minor market "jitters," allowing the tool to focus on more significant, underlying trends.
3. The Ergodic Calculation Once the smoothed trend and smoothed volatility are established, the script performs a ratio calculation. It takes the smoothed price movement and divides it by the smoothed magnitude of that movement, multiplying the result by 100. This produces a percentage-based value that represents the "strength" or "quality" of the current trend.
4. Final Visualization The final step applies one last smoothing pass to this ratio. The result is displayed on your chart as a histogram. This final line helps traders identify:
- Directional Strength: How confidently the price is moving in one direction.
- Momentum: Whether the current trend is accelerating or losing steam.
By stripping away the noise of individual price ticks and focusing on these smoothed ratios, the indicator aims to provide a clearer picture of market dynamics than raw price action alone.
/*-----------------------------+
|			       |
| Shared by www.Aptrafx.com    |
|			       |
+------------------------------*/

//+------------------------------------------------------------------+
//| Danny Feng                                           Ergodic.mq4 |
//+------------------------------------------------------------------+

#property indicator_separate_window
#property indicator_buffers 1
#property indicator_color1 Yellow
#property indicator_color2 Red
//---- input parameters
extern int r=2;
extern int s=5;
extern int u=8;
extern int smooth=2;

//---- buffers
double ErgBuffer[];
double ema_ErgBuffer[];
double Price_Delta1_Buffer[];
double Price_Delta2_Buffer[];
double s_ema1_Buffer[];
double s_ema2_Buffer[];
double u_ema1_Buffer[];
double u_ema2_Buffer[];

//+------------------------------------------------------------------+
//| Custom indicator initialization function                         |
//+------------------------------------------------------------------+
int init()
  {
   string short_name;
//---- additional buffers are used for counting.
   IndicatorBuffers(8);
   SetIndexBuffer(0,ema_ErgBuffer);
   SetIndexBuffer(1,ErgBuffer);
   SetIndexBuffer(2,Price_Delta1_Buffer);
   SetIndexBuffer(3,Price_Delta2_Buffer);
   SetIndexBuffer(4,s_ema1_Buffer);
   SetIndexBuffer(5,s_ema2_Buffer);
   SetIndexBuffer(6,u_ema1_Buffer);
   SetIndexBuffer(7,u_ema2_Buffer);

//---- indicator lines
   SetIndexStyle(0,DRAW_HISTOGRAM);
   SetIndexStyle(1,DRAW_HISTOGRAM);
//---- name for DataWindow and indicator subwindow label
   short_name="Ergodic";
   IndicatorShortName(short_name);
   SetIndexLabel(0,short_name);
//----
   SetIndexDrawBegin(0,r+s+u+smooth);
   SetIndexDrawBegin(1,r+s+u+smooth);
//----
   return(0);
  }
//+------------------------------------------------------------------+
//| True Strength Index                                          |
//+------------------------------------------------------------------+
int start() {
   int i,limit;
   double mean1, mean2;

   int counted_bars=IndicatorCounted();
   if(counted_bars>0) counted_bars--;
   limit=Bars-counted_bars;

   for(i=0; i<limit; i++) {
      //Price_Delta1_Buffer[i] = Close[i] - Close[i+r];
      //Price_Delta2_Buffer[i] = MathAbs(Close[i] - Close[i+r]);
      mean1 = (Close[i] + High[i] + Low[i]) /3;
      mean2 = (Close[i+r] + High[i+r] + Low[i+r]) /3;
      Price_Delta1_Buffer[i] = mean1 - mean2;
      Price_Delta2_Buffer[i] = MathAbs(mean1 - mean2);
   }

   for(i=0; i<limit; i++) {
      s_ema1_Buffer[i]=iMAOnArray(Price_Delta1_Buffer,Bars,s,0,MODE_EMA,i);
      s_ema2_Buffer[i]=iMAOnArray(Price_Delta2_Buffer,Bars,s,0,MODE_EMA,i);
   }

   for(i=0; i<limit; i++) {
      u_ema1_Buffer[i]=iMAOnArray(s_ema1_Buffer,Bars,u,0,MODE_EMA,i);
      u_ema2_Buffer[i]=iMAOnArray(s_ema2_Buffer,Bars,u,0,MODE_EMA,i);
   }

   for(i=0; i<limit; i++) {
      ErgBuffer[i] = 100 * u_ema1_Buffer[i] / u_ema2_Buffer[i] ;
   }

   for(i=0; i<limit; i++) {
      ema_ErgBuffer[i] = iMAOnArray(ErgBuffer,Bars,smooth,0,MODE_EMA,i);
   }
   return(0);
}
//+------------------------------------------------------------------+
Comments