EMAdensity
Download script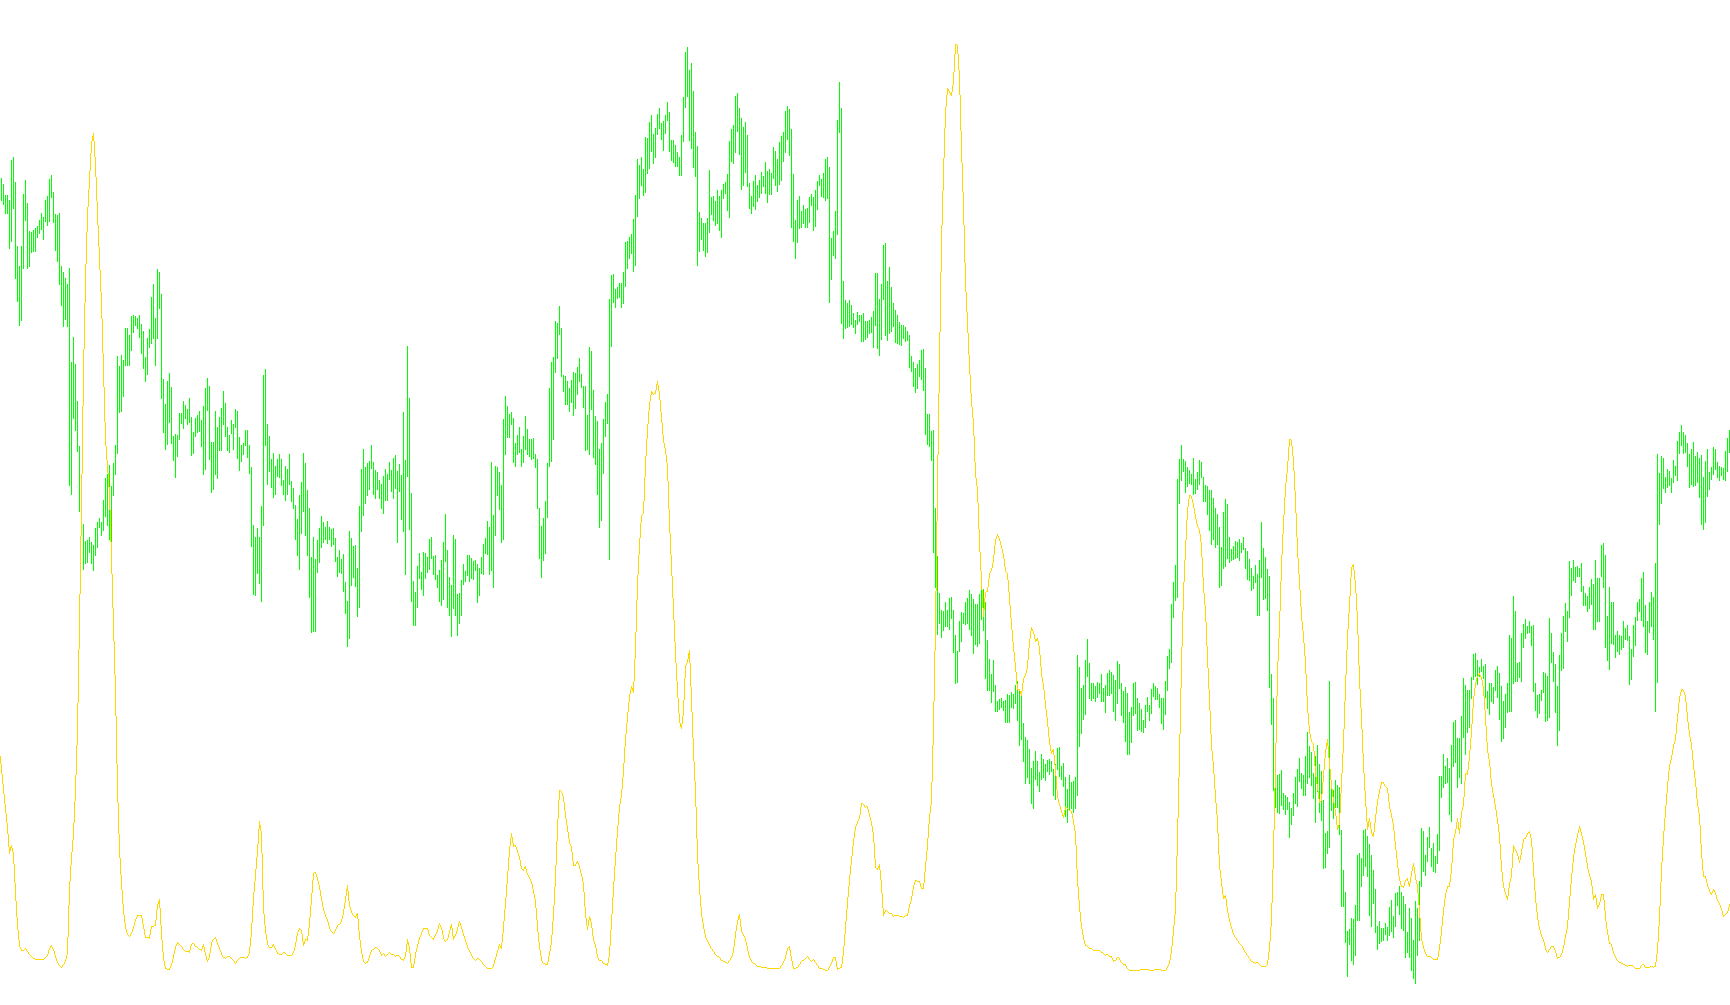
Indicator Overview
The EMA Density indicator is designed to measure the "tightness" or "congestion" of price trends by analyzing a group of moving averages simultaneously. Instead of showing you the price lines themselves, this tool calculates the mathematical spread between several different trend indicators to provide a visual representation of market volatility and stability.
How It Works
The logic behind this indicator follows a three-step process:
1. Multi-Layer Analysis The script tracks five distinct Exponential Moving Averages (EMAs) at once. These represent five different time horizons—specifically, the 10, 20, 30, 40, and 50-period averages. By looking at all five together, the indicator captures a broader view of the market's recent momentum across various short-to-medium timeframes.
2. Measuring the "Spread" (Variance) Rather than just looking at where the price is going, the tool calculates how far apart these five moving averages are from one another.
- When the moving averages are clustered very closely together, it indicates that different timeframes are in agreement, often suggesting a period of consolidation or a very steady, synchronized trend.
- When the moving averages begin to spread out significantly, it suggests a divergence in momentum, indicating increasing volatility or a potential shift in market direction.
3. Calculating Density The indicator takes this mathematical "spread" (known as variance) and converts it into a single numerical value scaled to 100. This final result is plotted on a separate window at the bottom of your chart.
Practical Interpretation
- Low Values: When the line on the indicator is low, it suggests that the various moving averages are "dense" or tightly packed. This typically indicates a period of market equilibrium or a very stable trend where short-term and medium-term prices are moving in high harmony.
- High Values: A spike or increase in the indicator's line represents an expansion in price action. It shows that the different moving averages are pulling away from each other, signaling increased volatility or a "loosening" of the current market structure.
By monitoring this density value, traders can better identify whether the market is currently in a state of calm agreement or if it is beginning to expand and become more unpredictable.
//+------------------------------------------------------------------+
//|                                                   EMAdensity.mq4 |
//|                                                             niva |
//|                                                        forex-tsd |
//+------------------------------------------------------------------+
#property copyright "niva"
#property link      "forex-tsd"

#property indicator_separate_window
#property indicator_buffers 1
#property indicator_color1 Red
double ExtMapBuffer1 [];
//+------------------------------------------------------------------+
//| Custom indicator initialization function                         |
//+------------------------------------------------------------------+
int init()
  {
//---- indicators
   SetIndexStyle(0,DRAW_LINE);
   SetIndexBuffer(0,ExtMapBuffer1);
   string short_name = "EMA lines desity!";
   IndicatorShortName(short_name);
//----
   return(0);
  }
//+------------------------------------------------------------------+
//| Custom indicator deinitialization function                       |
//+------------------------------------------------------------------+
int deinit()
  {
//----

//----
   return(0);
  }
//+------------------------------------------------------------------+
//| Custom indicator iteration function                              |
//+------------------------------------------------------------------+
int start()
  {
   int    counted_bars=IndicatorCounted();
   double ema1, ema2, ema3, ema4, ema5;
   double mean, variance, result;
   if (counted_bars < 0) return(-1);
   if (counted_bars >0) counted_bars --;
   int pos=Bars-counted_bars;
//----
   while(pos>=0)
   {
      ema1=iMA(NULL,0,10,0,MODE_EMA,PRICE_CLOSE,pos);
      ema2=iMA(NULL,0,20,0,MODE_EMA,PRICE_CLOSE,pos);
      ema3=iMA(NULL,0,30,0,MODE_EMA,PRICE_CLOSE,pos);
      ema4=iMA(NULL,0,40,0,MODE_EMA,PRICE_CLOSE,pos);
      ema5=iMA(NULL,0,50,0,MODE_EMA,PRICE_CLOSE,pos);
      mean = (ema1 +ema2+ema3+ema4+ema5)/5;
      variance = (square(ema1-mean)+square(ema2-mean)+square(ema3-mean)+square(ema4-mean)+square(ema5-mean))/5;
      result = 100*variance;

      ExtMapBuffer1[pos]=result;
      pos--;
    }

//----
   return(0);
  }

  double square(double number){
   double result;
   result=number*number;

   return(result);

  }
//+------------------------------------------------------------------+
Comments