EMA-Crossover_Signal_001
Download script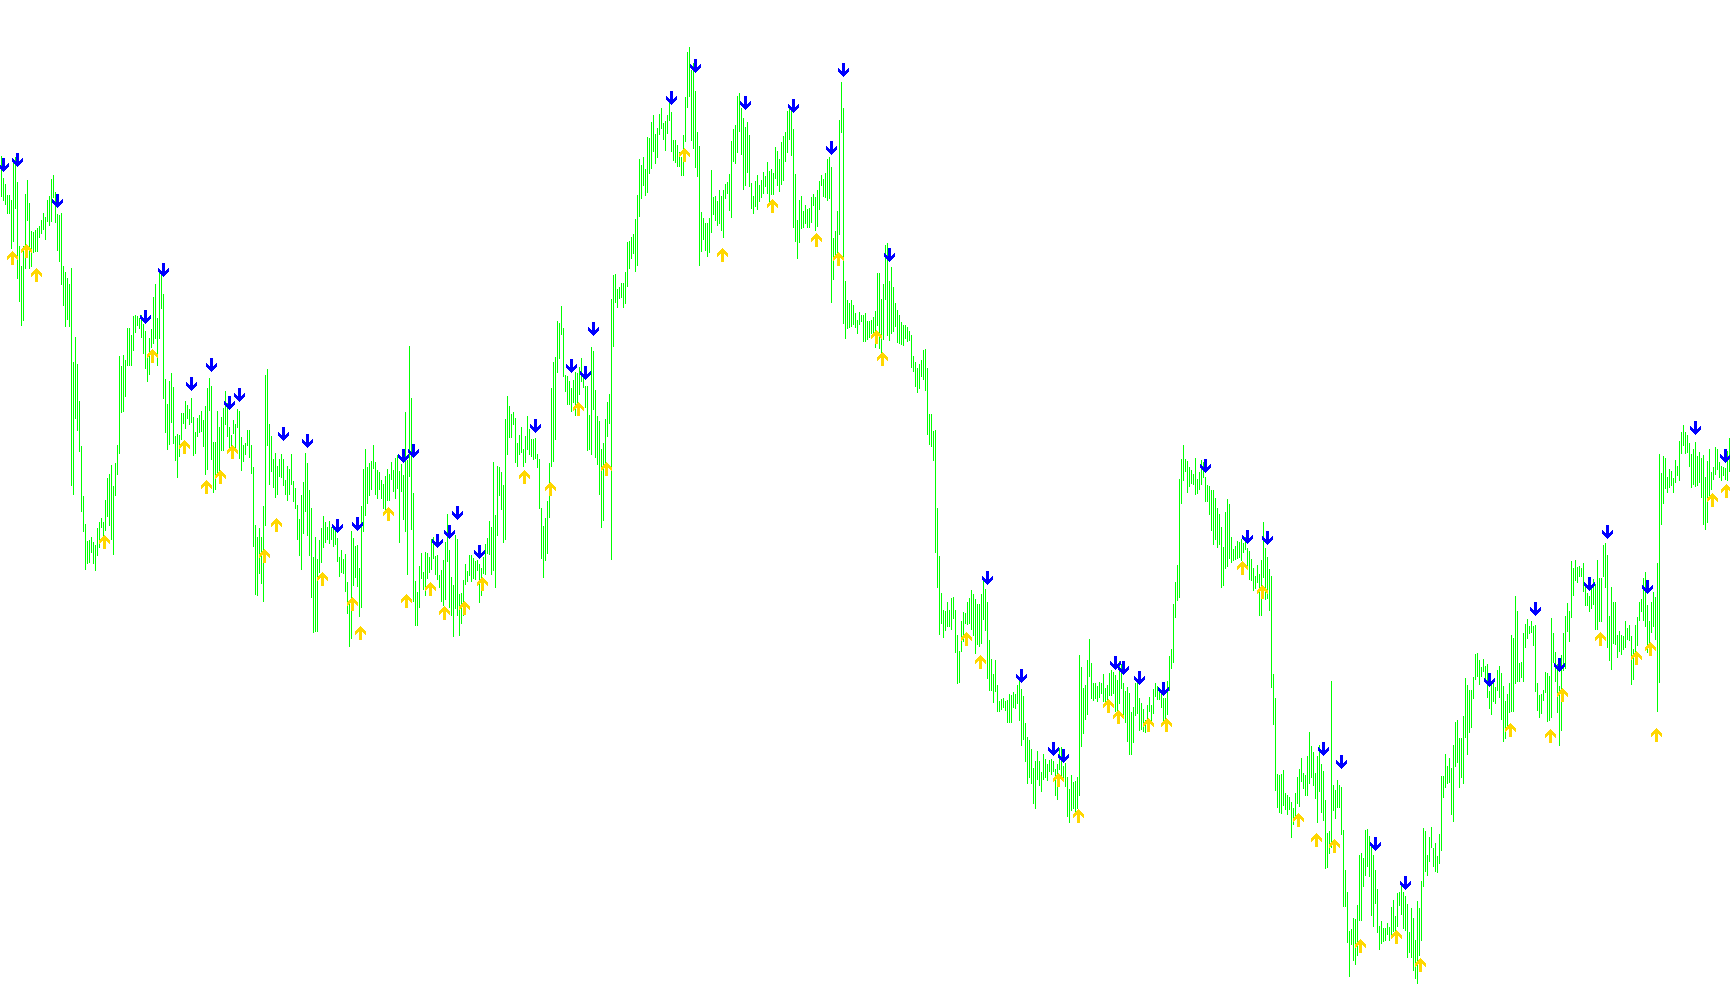
This tool is designed to simplify trend analysis by identifying specific moments when two moving averages intersect on a price chart. In technical trading, "Moving Averages" are used to smooth out price fluctuations to show the general direction of the market; however, on fast-moving charts, these lines can sometimes become difficult to see clearly due to the overlap of price bars.
How the Logic Works
The script functions by monitoring two different Exponential Moving Averages (EMAs)—a "Faster" one and a "Slower" one—simultaneously. Its primary goal is to detect the exact point where these two lines cross each other, which often signals a potential shift in market momentum.
Key features of the logic include:
- Precise Intersection Detection: The script doesn't just look at whether one line is above the other; it specifically looks for the transition. It checks the relationship between the lines at three distinct points in time: the current moment, the previous moment, and the subsequent moment. This ensures that a signal is only generated when a definitive "cross" actually occurs.
- Visual Signaling: To make these signals easy to spot, the tool places visual markers (arrows) directly on your chart:
- Upward Signals: When the faster moving average crosses above the slower one, a green marker appears.
- Downward Signals: When the faster moving average crosses below the slower one, a red marker appears.
- Dynamic Positioning: To ensure that these markers do not clutter your view or overlap with the price candles, the script automatically calculates the "range" of the current price action. It then places the markers at a slight distance above or below the candle based on that range, keeping the chart clean and readable.
Practical Use
By using this script, you can remove the moving average lines from your chart entirely if you prefer a minimalist look, while still receiving clear visual alerts whenever the underlying mathematical crossover occurs. This is particularly helpful for traders who want to identify entry or exit points based on momentum changes without being distracted by cluttered visual data.
//+------------------------------------------------------------------+
//|                                         EMA-Crossover_Signal.mq4 |
//|         Copyright © 2005, Jason Robinson (jnrtrading)            |
//|                   http://www.jnrtading.co.uk                     |
//+------------------------------------------------------------------+

/*
  +------------------------------------------------------------------+
  | Allows you to enter two ema periods and it will then show you at |
  | Which point they crossed over. It is more usful on the shorter   |
  | periods that get obscured by the bars / candlesticks and when    |
  | the zoom level is out. Also allows you then to remove the emas   |
  | from the chart. (emas are initially set at 5 and 6)              |
  +------------------------------------------------------------------+
*/
#property copyright "Copyright © 2005, Jason Robinson (jnrtrading)"
#property link      "http://www.jnrtrading.co.uk"

#property indicator_chart_window
#property indicator_buffers 2
#property indicator_color1 Green
#property indicator_color2 Red

double CrossUp[];
double CrossDown[];
extern int FasterEMA = 5;
extern int SlowerEMA = 6;
//+------------------------------------------------------------------+
//| Custom indicator initialization function                         |
//+------------------------------------------------------------------+
int init()
  {
//---- indicators
   SetIndexStyle(0, DRAW_ARROW, EMPTY);
   SetIndexArrow(0, 233);
   SetIndexBuffer(0, CrossUp);
   SetIndexStyle(1, DRAW_ARROW, EMPTY);
   SetIndexArrow(1, 234);
   SetIndexBuffer(1, CrossDown);
//----
   return(0);
  }
//+------------------------------------------------------------------+
//| Custom indicator deinitialization function                       |
//+------------------------------------------------------------------+
int deinit()
  {
//----

//----
   return(0);
  }
//+------------------------------------------------------------------+
//| Custom indicator iteration function                              |
//+------------------------------------------------------------------+
int start() {
   int limit, i, counter;
   double fasterEMAnow, slowerEMAnow, fasterEMAprevious, slowerEMAprevious, fasterEMAafter, slowerEMAafter;
   double Range, AvgRange;
   int counted_bars=IndicatorCounted();
//---- check for possible errors
   if(counted_bars<0) return(-1);
//---- last counted bar will be recounted
   if(counted_bars>0) counted_bars--;

   limit=Bars-counted_bars;

   for(i = 0; i <= limit; i++) {

      counter=i;
      Range=0;
      AvgRange=0;
      for (counter=i ;counter<=i+9;counter++)
      {
         AvgRange=AvgRange+MathAbs(High[counter]-Low[counter]);
      }
      Range=AvgRange/10;

      fasterEMAnow = iMA(NULL, 0, FasterEMA, 0, MODE_EMA, PRICE_CLOSE, i);
      fasterEMAprevious = iMA(NULL, 0, FasterEMA, 0, MODE_EMA, PRICE_CLOSE, i+1);
      fasterEMAafter = iMA(NULL, 0, FasterEMA, 0, MODE_EMA, PRICE_CLOSE, i-1);

      slowerEMAnow = iMA(NULL, 0, SlowerEMA, 0, MODE_EMA, PRICE_CLOSE, i);
      slowerEMAprevious = iMA(NULL, 0, SlowerEMA, 0, MODE_EMA, PRICE_CLOSE, i+1);
      slowerEMAafter = iMA(NULL, 0, SlowerEMA, 0, MODE_EMA, PRICE_CLOSE, i-1);

      if ((fasterEMAnow > slowerEMAnow) && (fasterEMAprevious < slowerEMAprevious) && (fasterEMAafter > slowerEMAafter)) {
         CrossUp[i] = Low[i] - Range*0.5;
      }
      else if ((fasterEMAnow < slowerEMAnow) && (fasterEMAprevious > slowerEMAprevious) && (fasterEMAafter < slowerEMAafter)) {
         CrossDown[i] = High[i] + Range*0.5;
      }
   }
   return(0);
}
Comments