DSRS
Download script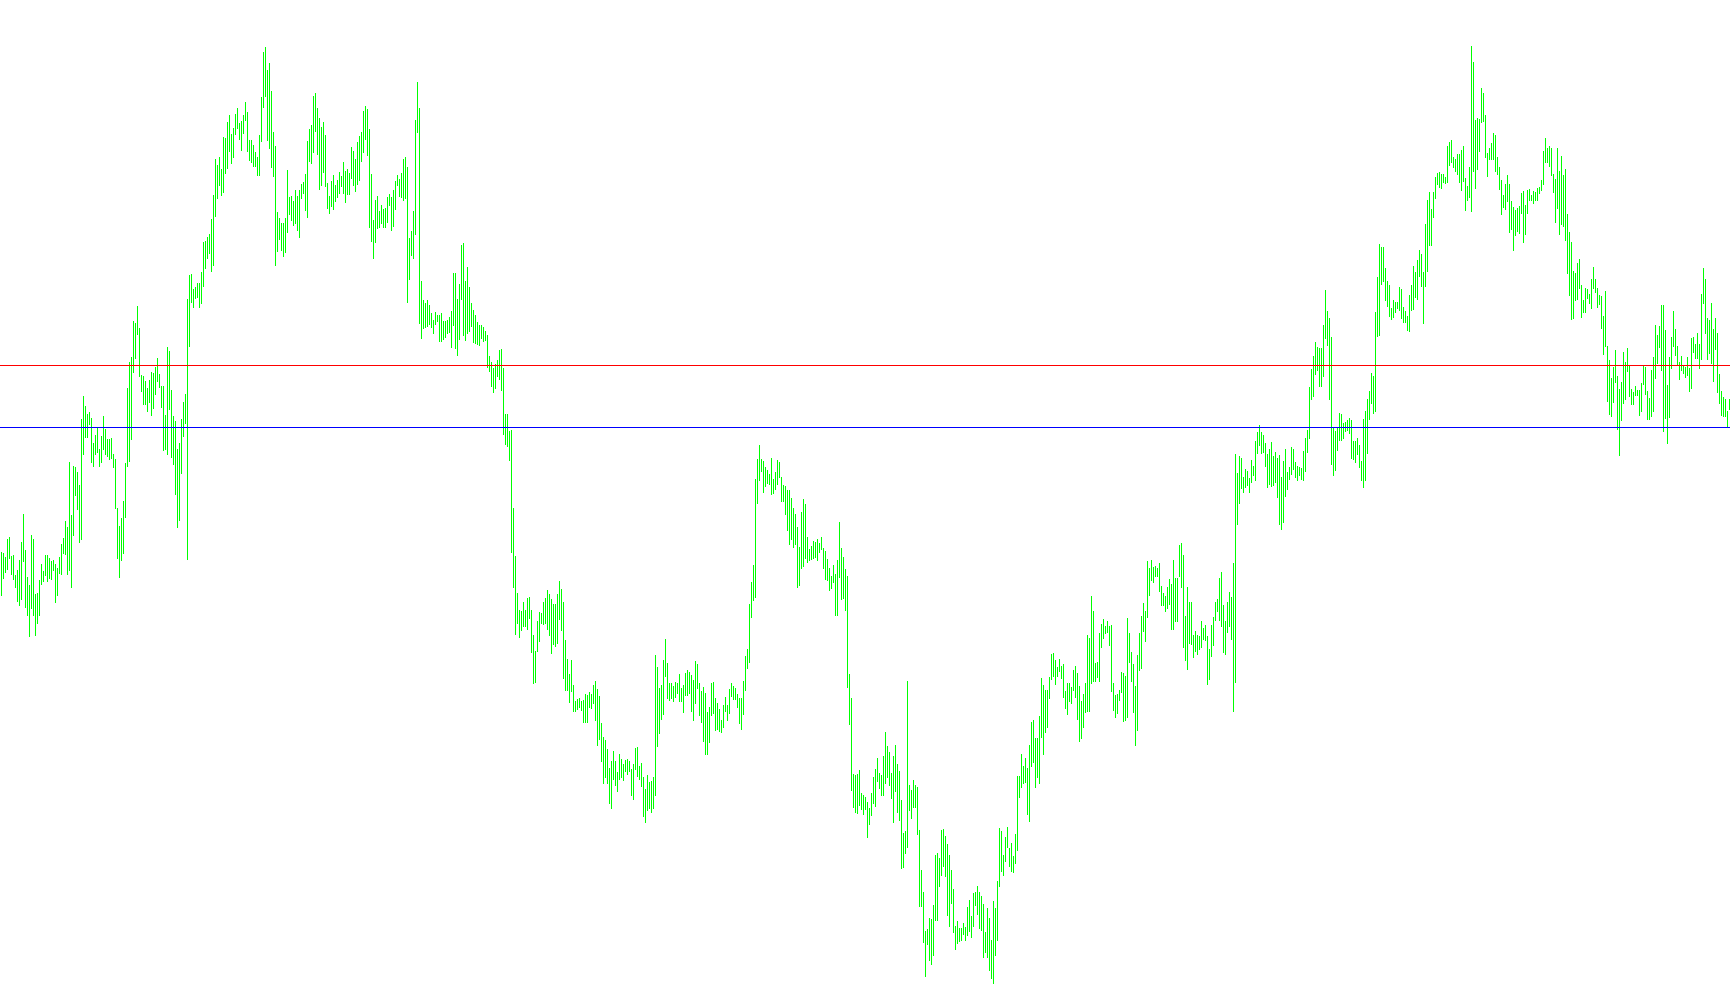
This tool is designed to automatically identify and visualize key price levels on your trading chart based on the previous day's market activity. By analyzing the "Daily" timeframe, it helps traders quickly see where significant price boundaries—specifically Support and Resistance—were established during the last completed session.
How it Works
The script looks at the data from the most recent finished day to determine the direction of the price movement. It specifically focuses on four key points: the Opening Price, the Closing Price, the Highest point reached (High), and the Lowest point reached (Low).
The logic follows a simple conditional flow based on whether the market ended higher or lower than it started:
-
If the market closed higher than it opened (Bullish Day):
- The tool identifies the highest price of that day as a Resistance level and draws a red line at that point.
- It identifies the opening price as a Support level and draws a blue line at that point.
-
If the market closed lower than it opened (Bearish Day):
- The tool identifies the opening price as a Resistance level and draws a red line at that point.
- It identifies the lowest price of that day as a Support level and draws a blue line at that point.
Key Features for Traders
- Automated Drawing: You do not need to manually place lines on your chart. The script automatically detects the previous day's data and plots the lines for you.
- Dynamic Updates: The script is designed to manage these objects on your screen, ensuring that the lines are updated or redrawn correctly as needed.
- Visual Clarity: By using distinct colors (Red for Resistance and Blue for Support), it provides an immediate visual cue of where the market might face difficulty breaking through (Resistance) or where it might find a "floor" to bounce off of (Support).
In summary, this tool simplifies technical analysis by instantly highlighting the structural boundaries created by yesterday's price action, allowing you to focus on your trading strategy rather than manual charting.
//+------------------------------------------------------------------+
//|                  Daily Support and Resistance Special            |
//|                                                         DSRS.mq4 |
//|                                              Developed by mqldev |
//|                                            http://www.mqldev.com |
//+------------------------------------------------------------------+

#property link      "http://www.mqldev.com"


#property indicator_chart_window

extern color   ResistanceColor = Red;
extern color   SupportColor    = Blue;

int init()
{
   DelObjs();
   return(0);
}
int deinit()
{
   DelObjs();
   return(0);
}

void start()
{
   double c = iClose(NULL,PERIOD_D1,1);
   double o = iOpen(NULL,PERIOD_D1,1);
   double h = iHigh(NULL,PERIOD_D1,1);
   double l = iLow(NULL,PERIOD_D1,1);


   Print("close:",c," open:",o," high:",h," low:",l);

   if (c>=o)
   {
      DrawLine(h,"Resistance",ResistanceColor);
      DrawLine(o,"Support",SupportColor);
   }
   else
   {
      DrawLine(o,"Resistance",ResistanceColor);
      DrawLine(l,"Support",SupportColor);
   }

   return(0);
}

int DrawLine(double price  , string Obj , color clr)
{

   int objs = ObjectsTotal();
   string name;
   for(int cnt=ObjectsTotal()-1;cnt>=0;cnt--)
   {
      name=ObjectName(cnt);
      if (StringFind(name,Obj,0)>-1)
      {
         ObjectMove(Obj,0,Time[0],price);
         ObjectsRedraw();
         return(1);
      }
   }
   ObjectCreate(Obj,OBJ_HLINE,0,0,price);
   ObjectSet(Obj,OBJPROP_COLOR,clr);
   WindowRedraw();
   return(0);
}

void DelObjs()
{
   int objs = ObjectsTotal();
   string name;
   for(int cnt=ObjectsTotal()-1;cnt>=0;cnt--)
   {
      name=ObjectName(cnt);
      if (StringFind(name,"L",0)>-1) ObjectDelete(name);
      WindowRedraw();
   }
}
Comments