DonchianChannels
Download script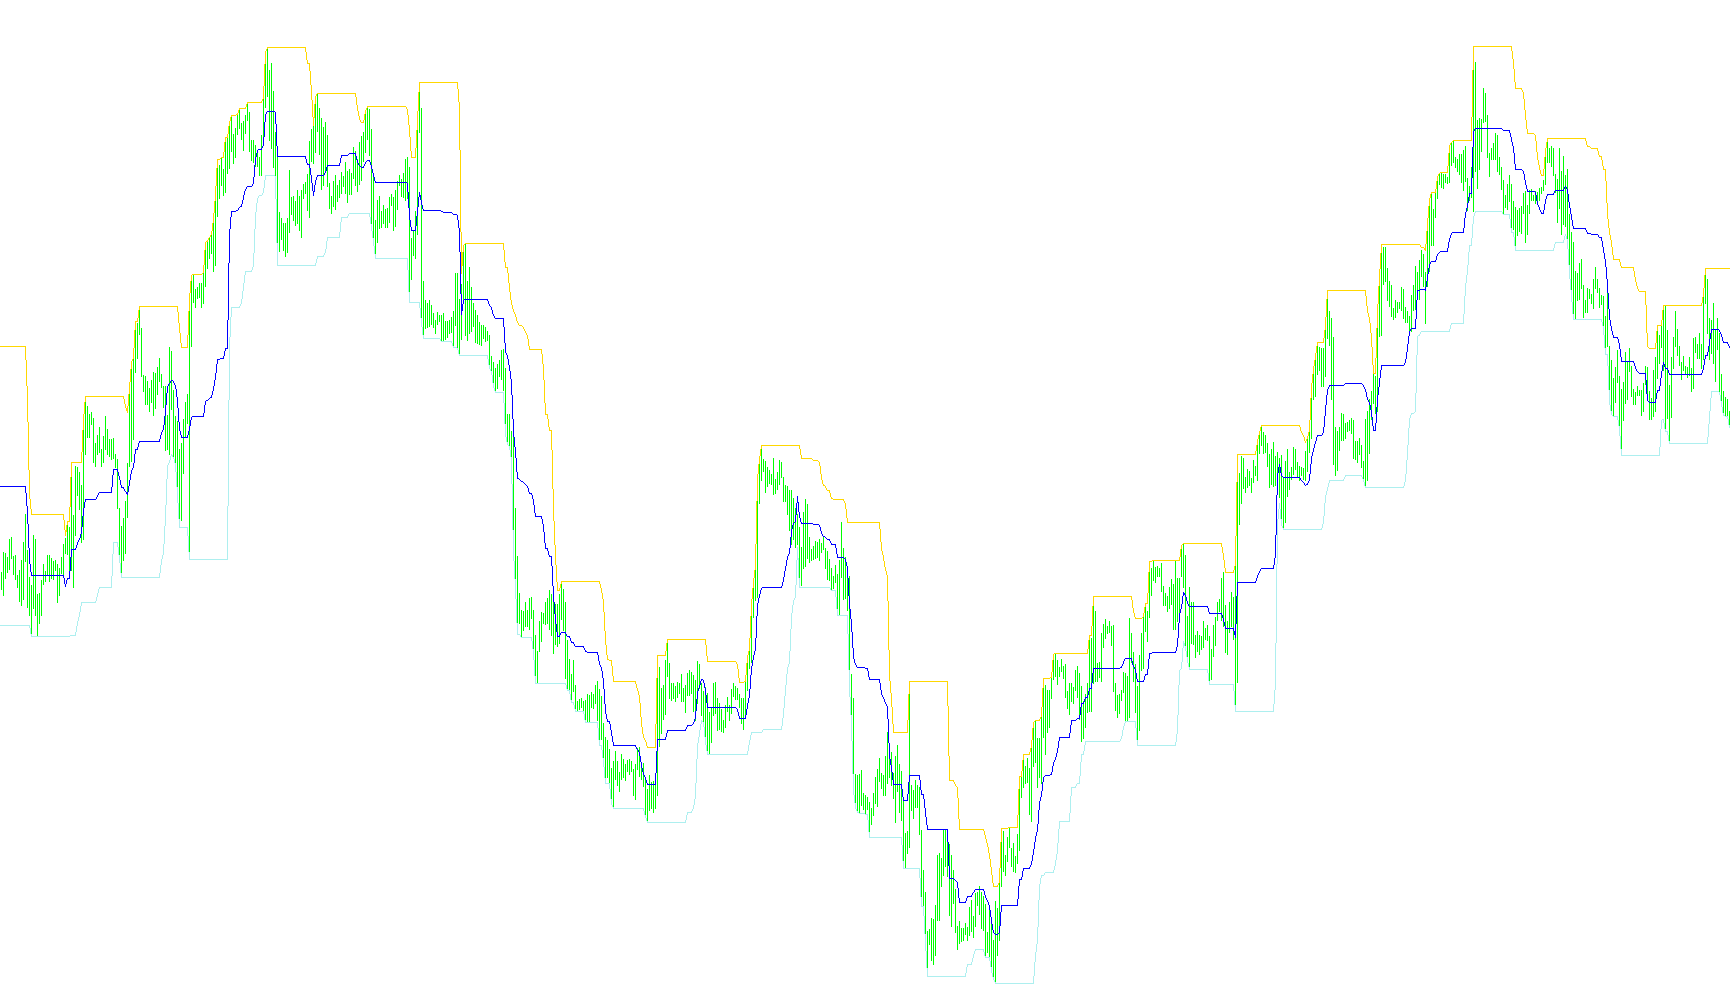
This tool is designed to provide a visual representation of price volatility and range on your trading charts. It functions by creating a three-line channel that helps identify the boundaries of recent market activity, allowing traders to better understand where prices are currently oscillating.
How the Logic Works
The script operates based on a user-defined lookback period (the number of candles it analyzes at any given moment). Instead of simply looking at the latest price, it scans this specific window of time to identify the extremes of market movement.
1. Identifying the Boundaries (Upper and Lower Lines)
- The Upper Line: The script constantly scans the specified number of recent candles to find the highest price reached during that period. It then plots a line at that peak value.
- The Lower Line: Similarly, it scans the same window of candles to find the lowest price reached. It then plots a line at that minimum value.
By connecting these two extremes, the tool creates a " коридор" (corridor) that represents the total price range for that specific timeframe.
2. Establishing the Equilibrium (Middle Line)
- The Middle Line: To provide a central reference point, the script calculates the mathematical average between the highest and lowest points found. By placing this line exactly in the center of the upper and lower boundaries, it creates a baseline to help identify whether the price is currently leaning toward the top or bottom of its recent range.
Key Benefits for Traders
Because these lines update dynamically as new candles form, they provide a real-time view of market "room." When the price stays within these channels, it suggests a period of consolidation. When the price breaks significantly above the upper line or below the lower line, it signals that the market is moving beyond its recent established boundaries, potentially indicating a shift in trend or a breakout in momentum.
//+------------------------------------------------------------------+
//|                                             DonchainChannels.mq4 |
//|                                         Copyright 2014, RasoulFX |
//|                                     http://rasoulfx.blogspot.com |
//+------------------------------------------------------------------+
#property copyright "Copyright 2014, RasoulFX"
#property link      "http://rasoulfx.blogspot.com"
#property version   "1.00"
#property strict
#property indicator_chart_window
#property indicator_buffers 3
#property indicator_color1 Red
#property indicator_color2 Blue
#property indicator_color3 Green
#property indicator_width1 1
#property indicator_width2 1
#property indicator_width3 1

input int BarsToCount=20;

double     upper[];
double     middle[];
double     lower[];

//+------------------------------------------------------------------+
//| Custom indicator initialization function                         |
//+------------------------------------------------------------------+
int OnInit()
{
   IndicatorShortName("DCH("+IntegerToString(BarsToCount)+")");

   SetIndexBuffer(0,upper);
   SetIndexBuffer(1,middle);
   SetIndexBuffer(2,lower);

   SetIndexStyle(0,DRAW_LINE);
   SetIndexStyle(1,DRAW_LINE);
   SetIndexStyle(2,DRAW_LINE);

   SetIndexLabel(0,"Upper");
   SetIndexLabel(1,"Middle");
   SetIndexLabel(2,"Lower");
//---
   return(INIT_SUCCEEDED);
}
//+------------------------------------------------------------------+
//| Custom indicator iteration function                              |
//+------------------------------------------------------------------+
int OnCalculate(const int rates_total,
                const int prev_calculated,
                const datetime &time[],
                const double &open[],
                const double &high[],
                const double &low[],
                const double &close[],
                const long &tick_volume[],
                const long &volume[],
                const int &spread[])
{
//---
   //static int old_bars;
   //if(old_bars == Bars) return(0);

   //int counted_bars = IndicatorCounted();
   //if(counted_bars>0) counted_bars--;

   //int limit = Bars - counted_bars;
   int limit = rates_total - prev_calculated;
   if(prev_calculated > 0) limit++;

   for(int i=0; i < limit; i++)
   {
      upper[i]=iHigh(Symbol(),Period(),iHighest(Symbol(),Period(),MODE_HIGH,BarsToCount,i));
      lower[i]=iLow(Symbol(),Period(),iLowest(Symbol(),Period(),MODE_LOW,BarsToCount,i));
      middle[i] = (upper[i]+lower[i])/2;
   }

   //old_bars = Bars;
//--- return value of prev_calculated for next call
   return(rates_total);
}
//+------------------------------------------------------------------+
Comments