Dolly_v01_v2
Download script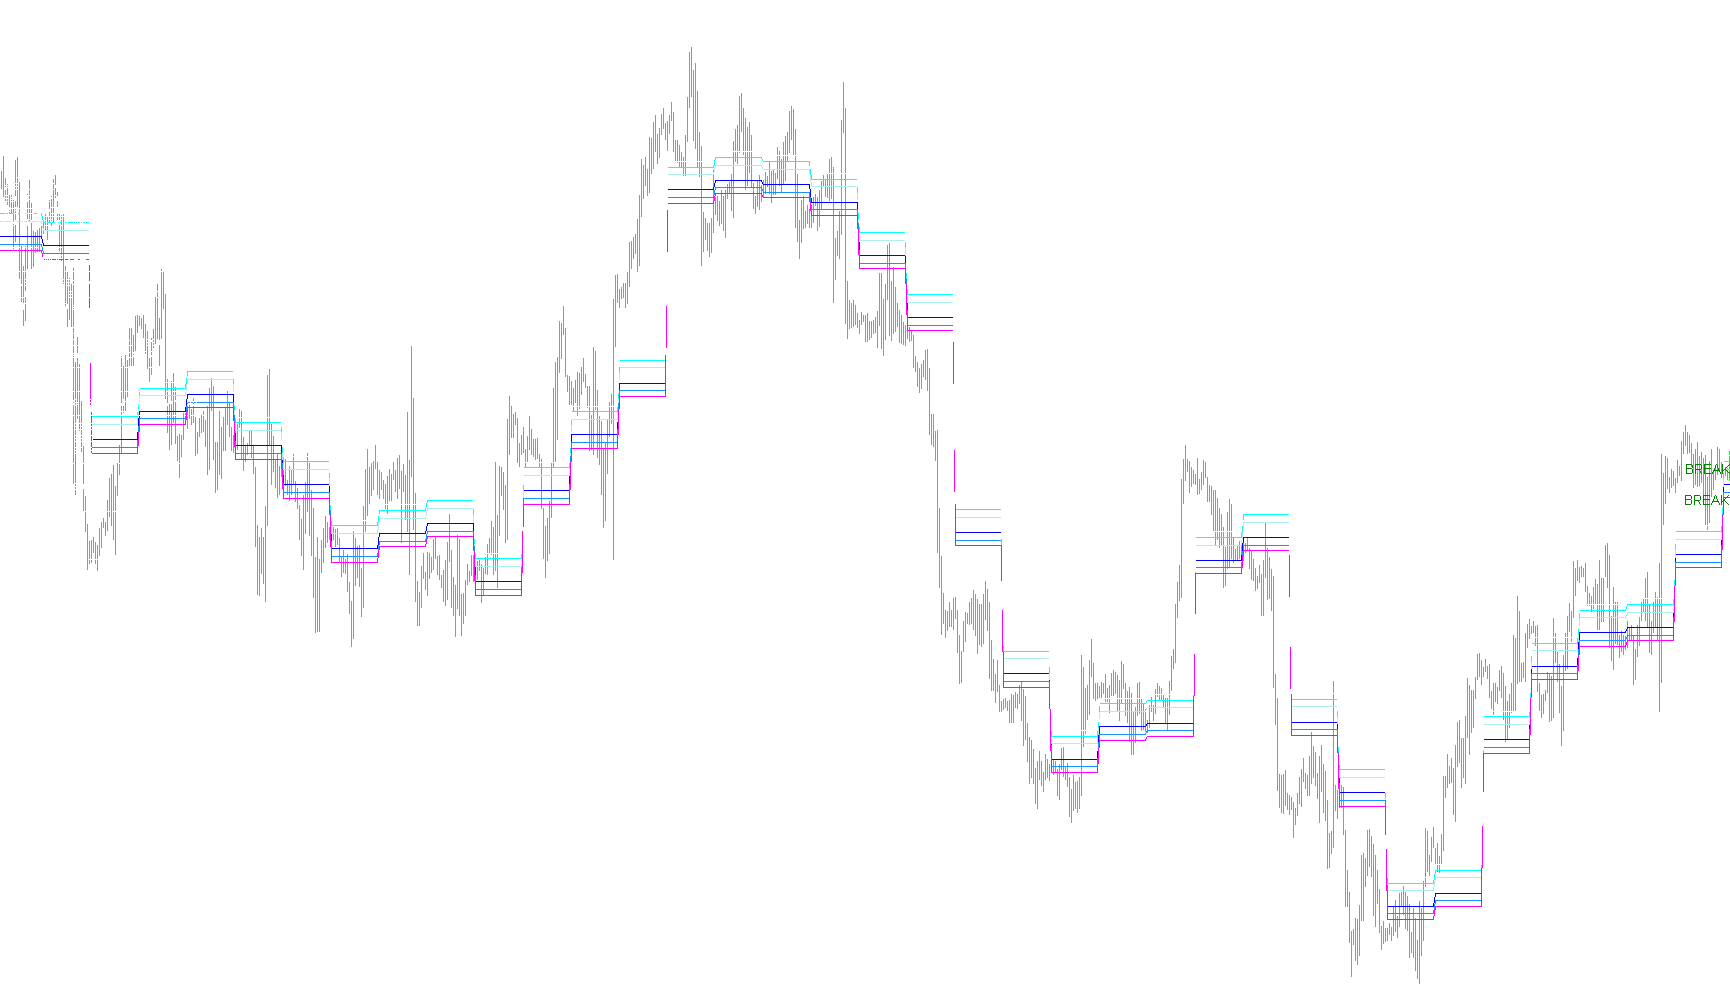
Overview of the Dolly Indicator Logic
The "Dolly" script is a financial analysis tool designed to assist traders in identifying key price levels and potential entry/exit points. Its primary logic revolves around identifying Pivot Points, which are used to determine market momentum, and establishing specific "Buy" and "Sell" zones based on historical price data.
Core Functionality
1. Dynamic Pivot Point Calculation The script automatically identifies the previous day's price action—specifically the High, Low, and Closing prices. It uses these three values to calculate a central "Pivot" point. This pivot serves as the baseline for the rest of the technical analysis.
2. Momentum Breakout Zones Beyond simple pivots, the script calculates several dynamic zones designed to highlight market movement:
- Buy and Sell Areas: These are immediate zones generated around the pivot point to identify where the price might experience a shift in momentum.
- Breakout Levels: The script identifies specific points where a "Break High" or "Break Low" occurs, signaling potential trend reversals or continuations.
- Target Levels: It projects long-term target areas (High and Low) based on the calculated volatility of the price.
3. Support and Resistance Mapping The tool performs advanced calculations to plot standard Support (S1, S2, S3) and Resistance (R1, R2, R3) levels for the current day. These are calculated using a mathematical progression from the daily high and low ranges, providing a roadmap of where the price might face "friction" or find balance.
4. Real-Time Trade Strategy Guidance One of the most distinct features of this script is its ability to translate raw data into actionable trading instructions. It generates an on-screen commentary that provides specific "Stop" and "Take Profit" (TP) coordinates for two different market scenarios:
- Breakout Strategy: Instructions for when the price aggressively breaks through established levels.
- Correction Strategy: Guidance for "Upper" or "Lower" corrections, helping traders navigate price pullbacks in an existing trend.
Visual and Informational Output
The script organizes this complex data into a readable format on the trading chart:
- On-Chart Labels: It places text markers directly on the chart to highlight "Sell Areas," "Buy Areas," and specific targets.
- Data Dashboard: A comprehensive summary appears in the corner of the screen, displaying exact price coordinates for every support level, resistance level, and suggested trade entry/exit point based on the current market behavior.
Technical Constraints
To ensure accuracy, the script is designed to operate most effectively on timeframes of 4 hours or less. It also includes logic to handle weekends, ensuring that the data pulled from the previous trading session remains consistent even when markets are closed.
//+------------------------------------------------------------------+
//|                                         Dolly (the famous sheep) |
//|               original indicator is called valasholic13 v2.5.mq4 |
//|                                                                  |
//|                  and the original author is valasholic@yahoo.com |
//|                                                                  |
//|                        mods and stuff by Linuxser for Forex-TSD  |
//|                      (there is a lot of usefull code inside here)|
//|Credits: hulahula (traslation from original indonesian language)  |
//+------------------------------------------------------------------+
#property copyright ""
#property link      ""
//----
#property indicator_chart_window
//#property indicator_separate_window
#property indicator_buffers 7
#property indicator_color1  Snow
#property indicator_width1 0
#property indicator_color2  Red
#property indicator_width2 3
#property indicator_color3  Blue
#property indicator_width3 3
#property indicator_color4  Crimson
#property indicator_width4 2
#property indicator_color5  SteelBlue
#property indicator_width5 2
#property indicator_color6  Lime
#property indicator_width6 1
#property indicator_color7  Lime
#property indicator_width7 1
//---- input parameters
//---- buffers
double PBuffer[];
double J1Buffer[];
double B1Buffer[];
double J2Buffer[];
double B2Buffer[];
double J3Buffer[];
double B3Buffer[];
string Pivot="Pivot Point", Jual1="S 1", Beli1="R 1";
string Jual2="S 2", Beli2="R 2", Jual3="S 3", Beli3="R 3";
int fontsize=10;
double P, J1, B1, J2, B2, J3, B3;
double LastHigh, LastLow, x;
double D4=0.55;
//+------------------------------------------------------------------+
//| Custor indicator deinitialization function                       |
//+------------------------------------------------------------------+
int deinit()
  {
   // ObjectDelete("Pivot");
   ObjectDelete("Jual1");
   ObjectDelete("Beli1");
   ObjectDelete("Jual2");
   ObjectDelete("Beli2");
   ObjectDelete("Jual3");
   ObjectDelete("Beli3");
//----
   return(0);
  }
//+------------------------------------------------------------------+
//| Custom indicator initialization function                         |
//+------------------------------------------------------------------+
int init()
  {
//---- indicator line
   SetIndexStyle(0, DRAW_NONE);
   SetIndexStyle(1, DRAW_LINE);
   SetIndexStyle(2, DRAW_LINE);
   SetIndexStyle(3, DRAW_LINE);
   SetIndexStyle(4, DRAW_LINE);
   SetIndexStyle(5, DRAW_LINE);
   SetIndexStyle(6, DRAW_LINE);
   SetIndexBuffer(0, PBuffer);
   SetIndexBuffer(1, J1Buffer);
   SetIndexBuffer(2, B1Buffer);
   SetIndexBuffer(3, J2Buffer);
   SetIndexBuffer(4, B2Buffer);
   SetIndexBuffer(5, J3Buffer);
   SetIndexBuffer(6, B3Buffer);
//---- name for DataWindow and indicator subwindow label
   //IndicatorShortName("Pivot Point");
   //SetIndexLabel(0, "Pivot Point");
//----
   SetIndexDrawBegin(0,1);
   IndicatorDigits(MarketInfo(Symbol(),MODE_DIGITS));
//----
   return(0);
  }
//+------------------------------------------------------------------+
//| Custom indicator iteration function                              |
//+------------------------------------------------------------------+
int start()
  {
   int counted_bars=IndicatorCounted();
   int limit, i;
   Print(DoubleToStr(Close[i], Digits));
   Print(DoubleToStr(Close[0], Digits));
   Print(DoubleToStr(Close[0], Digits));
//---- indicator calculation
   if(counted_bars==0)
     {
      x=Period();
      if(x > 240)
         return(-1);
      ///////////To Make a Line for SELL/BUY \\\\\\\\\\\\\
      //ObjectCreate("Pivot", OBJ_TEXT, 0, 0, 0);
      //ObjectSetText("Pivot", "                PIVOT", fontsize, "Arial", Black);
      ObjectCreate("Jual1", OBJ_TEXT, 0, 0, 0);
      ObjectSetText("Jual1", "                       SELL AREA", fontsize, "Arial", Green);
      ObjectCreate("Beli1", OBJ_TEXT, 0, 0, 0);
      ObjectSetText("Beli1", "                       BUY AREA", fontsize, "Arial", Green);
      ObjectCreate("Jual2", OBJ_TEXT, 0, 0, 0);
      ObjectSetText("Jual2", "                       BREAK LOW, TAKE PROFIT", fontsize, "Arial", Green);
      ObjectCreate("Beli2", OBJ_TEXT, 0, 0, 0);
      ObjectSetText("Beli2", "                       BREAK HIGH,TAKE PROFIT", fontsize, "Arial", Green);
      ObjectCreate("Jual3", OBJ_TEXT, 0, 0, 0);
      ObjectSetText("Jual3", "                       TARGET", fontsize, "Arial", Green);
      ObjectCreate("Beli3", OBJ_TEXT, 0, 0, 0);
      ObjectSetText("Beli3", "                       TARGET", fontsize, "Arial", Green);
     }
   if(counted_bars < 0)
      return(-1);
//---- last counted bar will be recounted
   //   if(counted_bars>0) counted_bars--;
   limit=(Bars - counted_bars) - 1;
//----
   for(i=limit; i>=0; i--)
     {
      if(High[i+1] > LastHigh)
         LastHigh=High[i+1];
      //----
      if(Low[i+1] < LastLow)
         LastLow=Low[i+1];
      if(TimeDay(Time[i])!=TimeDay(Time[i+1]))
        {
         Print(DoubleToStr(Close[i], Digits));
         Print(DoubleToStr(High[0], Digits));
         Print(DoubleToStr(Low[0], Digits));
         //////////// Logic for determinate Momentum Break \\\\\\\\\\\\\\\\\\\\\
         P=(LastHigh + LastLow + Close[i+1])/3; // Logic for determinating pivot
         B1=P + 20*Point; // Logic to determinate Buy Area (Can be change as you analize)
         J1=P - 20*Point; // Logic to determinate Sell Area (Can be change as you analize)
         B2=P + 40*Point; // Logic to determinate High Break Area (Can be change as you analize)
         J2=P - 40*Point; // Logic to determinate Low Break Area (Can be change as you analize)
         B3=P + 55*Point; // Logic to determinate High Target Area (Can be change as you analize)
         J3=P - 55*Point; // Logic to determinate Low Target Area (Can be change as you analize)
         //Re2 = P + (LastHigh - LastLow); //This is the logic for R3
         //Su2 = P - (LastHigh - LastLow); // This is the logic for S3
         //Re3 = (2*P) + (LastHigh - (2*LastLow)); // This is the logic for R3
         //Su3 = (2*P) - ((2* LastHigh) - LastLow); //This is the logic for S3
         LastLow=Open[i];
         LastHigh=Open[i];
         //----
         //ObjectMove("Pivot", 0, Time[i], P);
         ObjectMove("Jual1", 0, Time[i], J1);
         ObjectMove("Beli1", 0, Time[i], B1);
         ObjectMove("Jual2", 0, Time[i], J2);
         ObjectMove("Beli2", 0, Time[i], B2);
         ObjectMove("Jual3", 0, Time[i], J3);
         ObjectMove("Beli3", 0, Time[i], B3);
        }
      PBuffer[i]=P;
      J1Buffer[i]=J1;
      B1Buffer[i]=B1;
      J2Buffer[i]=J2;
      B2Buffer[i]=B2;
      J3Buffer[i]=J3;
      B3Buffer[i]=B3;
      //----
      double rates[1][6],yesterday_close,yesterday_high,yesterday_low;
      ArrayCopyRates(rates, Symbol(), PERIOD_D1);
//----
      if(DayOfWeek()==1)
        {
         if(TimeDayOfWeek(iTime(Symbol(),PERIOD_D1,1))==5)
           {
            yesterday_close=rates[1][4];
            yesterday_high=rates[1][3];
            yesterday_low=rates[1][2];
           }
         else
           {
            for(int d=5;d>=0;d--)
              {
               if(TimeDayOfWeek(iTime(Symbol(),PERIOD_D1,d))==5)
                 {
                  yesterday_close=rates[d][4];
                  yesterday_high=rates[d][3];
                  yesterday_low=rates[d][2];
                 }
              }
           }
        }
      else
        {
         yesterday_close=rates[1][4];
         yesterday_high=rates[1][3];
         yesterday_low=rates[1][2];
        }
      //---- Calculate Pivots
      double R=yesterday_high - yesterday_low;//range
      double p=(yesterday_high + yesterday_low + yesterday_close)/3;// Standard Pivot
      double r3=(2*p)+(yesterday_high-(2*yesterday_low));
      double r2=p+(yesterday_high - yesterday_low);
      double r1=(2*p)-yesterday_low;
      double s1=(2*p)-yesterday_high;
      double s2=p-(yesterday_high - yesterday_low);
      double s3=(2*p)-((2* yesterday_high)-yesterday_low);
      //----
      Comment ("\n Dolly 0.1 ( BREAKOUT STRATEGY ) "
      +"\n "
      +"\n \n -------------------------------------------------------------------"
      +"\n :::::::::::: DURING AROUND 2 BREAK ::::::::::::"
      +"\n -------------------------------------------------------------------"
      +"\n BUY AREA (break) :"
      +"\n # BUY STOP1  "+Symbol()+" TO "+(DoubleToStr (B1Buffer[i],Digits))
      +"\n Set TP "+(DoubleToStr (B2Buffer[i],Digits))+" and SL TO "+(DoubleToStr(J1Buffer[i],Digits))
      +"\n # BUY STOP2  "+Symbol()+" TO "+(DoubleToStr(B2Buffer[i],Digits))
      +"\n Set TP "+(DoubleToStr ((B2Buffer[i]+(10*Point)),Digits))+" and SL TO "+(DoubleToStr (B1Buffer[i],Digits))
      +"\n \n SELL AREA (break) :"
      +"\n # SELL STOP  "+Symbol()+" TO "+(DoubleToStr (J1Buffer[i],Digits))
      +"\n Set TP "+(DoubleToStr (J2Buffer[i],Digits))+" and SL to "+(DoubleToStr (B1Buffer[i],Digits))
      +"\n # SELL STOP2  "+Symbol()+" TO "+(DoubleToStr (J2Buffer[i],Digits))
      +"\n Set TP "+(DoubleToStr ((J2Buffer[i]-(10*Point)),Digits))+" and SL TO "+(DoubleToStr(J1Buffer[i],Digits))
//----
      +"\n \n -------------------------------------------------------------------"
      +"\n :::::::::::: WHEN PASSING THE CORRECTION ::::::::::::"
      +"\n -------------------------------------------------------------------"
      +"\n LOWER CORRECTION :"
      +"\n # BUY STOP  "+Symbol()+" TO "+(DoubleToStr(J2Buffer[i],Digits))
      +"\n Set TP "+(DoubleToStr(B1Buffer[i],Digits))+" and SL TO "+(DoubleToStr(J3Buffer[i],Digits))
      +"\n \n UPPER CORRECTION :"
      +"\n # SELL STOP  "+Symbol()+" TO "+(DoubleToStr(B2Buffer[i],Digits))
      +"\n Set TP "+(DoubleToStr(J1Buffer[i],Digits))+" and SL TO "+(DoubleToStr(B3Buffer[i],Digits))
      +"\n -------------------------------------------------------------------"
      +"\n \n -------------------------------------------------------------------"
      +"\n :::::: SUPPORT & RESISTANCE TODAY :::::"
      +"\n -------------------------------------------------------------------"
      +"\n Resistance 3 :"+(DoubleToStr(r3,Digits))
      +"\n Resistance 2 :"+(DoubleToStr(r2,Digits))
      +"\n Resistance 1 :"+(DoubleToStr(r1,Digits))
      +"\n -------------------------------------------------------------------"
      +"\n \n Pivot level :"+(DoubleToStr(p,Digits))
      +"\n \n -------------------------------------------------------------------"
      +"\n Support 1 :"+(DoubleToStr(s1,Digits))
      +"\n Support 2 :"+(DoubleToStr(s2,Digits))
      +"\n Support 3 :"+(DoubleToStr(s3,Digits))
      +"\n -------------------------------------------------------------------");
      //HOW TO MAKE THE PRICE LINE OF THE SUPPORT & RESISTANT APPEAR?
      //WAITING FOR NEXT TIP & UP DATE
     }
//----
   return(0);
  }
//+------------------------------------------------------------------+
Comments