dailychannel
Download script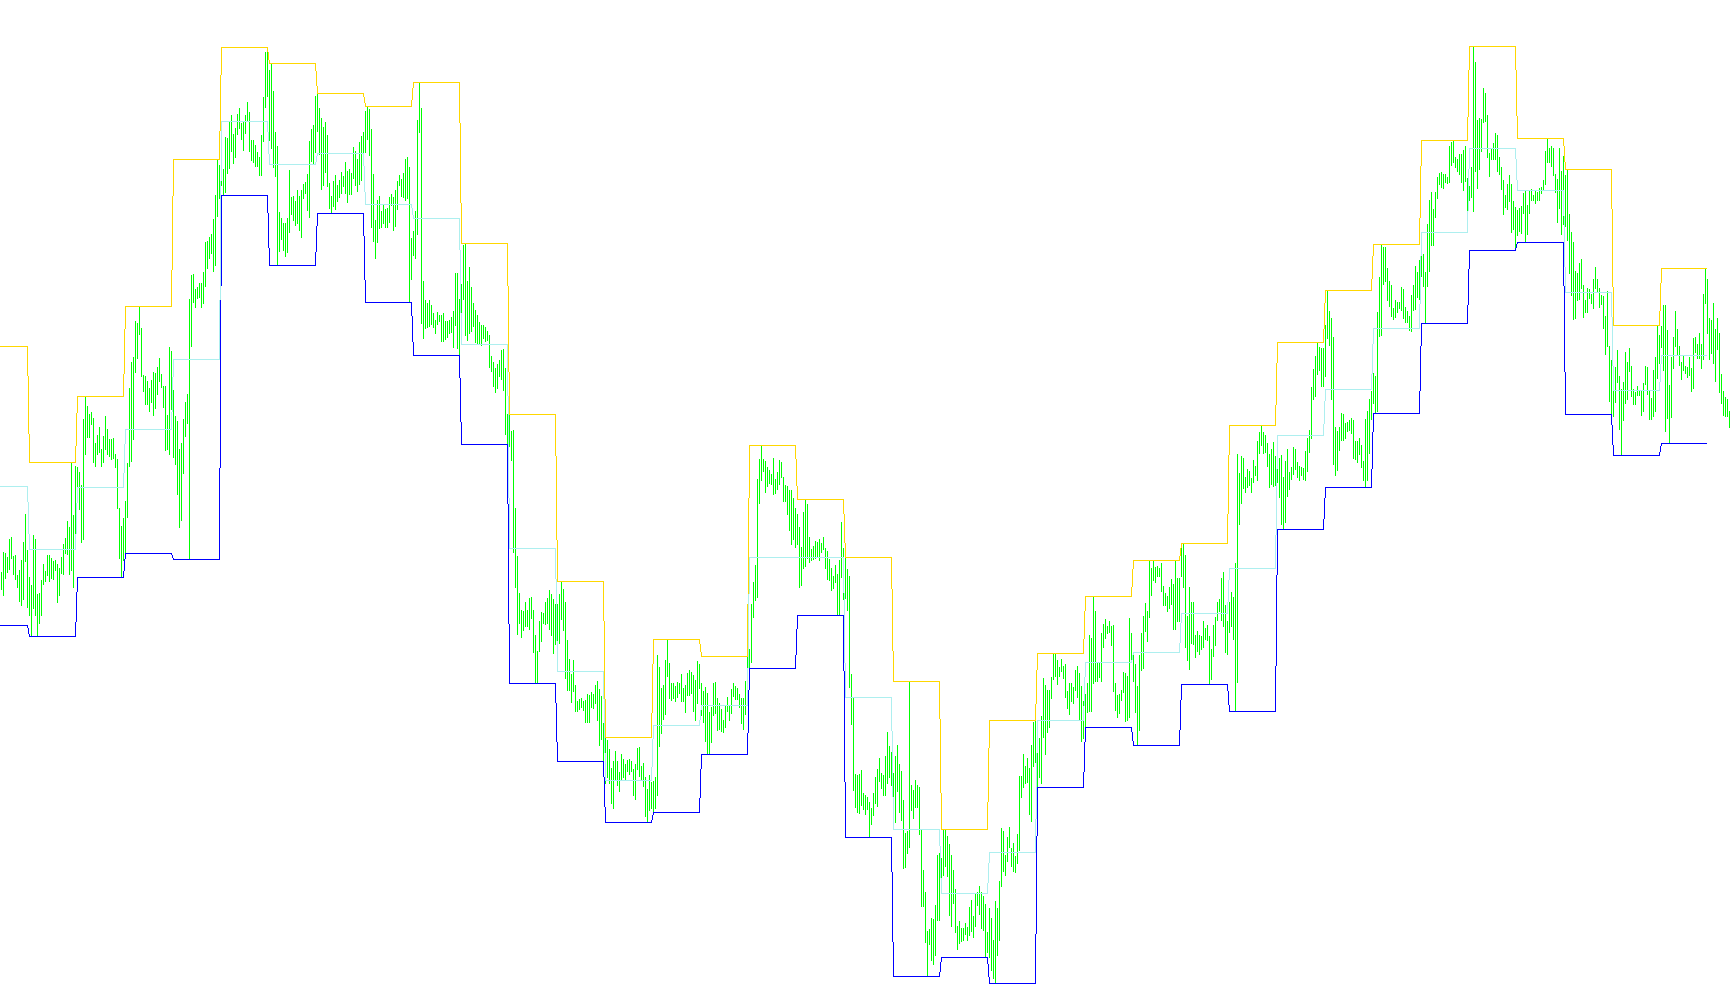
This script is a specialized trading tool designed to visually map out price boundaries on your charts. It automatically identifies and draws a "Daily Channel" by calculating the historical extremes of the market during specific timeframes.
Core Functionality
The primary purpose of this tool is to provide traders with clear, visible markers for the High, Low, and Middle price points of a given period. Instead of manually searching through history to find where the price peaked or bottomed out, the script performs these calculations instantly and plots them as solid lines on your chart.
Key Features & Logic
- Automated Boundary Detection: The script scans past data to identify the highest and lowest prices reached within a specific timeframe. It then calculates the mathematical midpoint between those two extremes to create a "Middle" line.
- Dynamic Visual Mapping:
- High Line: Plotted in Blue, marking the upper boundary.
- Low Line: Plotted in Red, marking the lower boundary.
- Middle Line: Plotted in Green, marking the center of the range.
- Time Zone Synchronization: The tool is built with flexible time zone logic. It allows you to sync your local trading time with a specific "Daily Time Zone" (defaulting to UTC-5 / East USA). This ensures that the boundaries are calculated accurately regardless of where in the world you are located.
- Smart Vertical Markers: To enhance readability, the script automatically places vertical lines at the start of new daily periods. This helps you instantly distinguish between different trading days on a cluttered chart.
- Compatibility Safety: The tool includes built-in checks to ensure it only runs on appropriate timeframes (specifically optimized for 1-Hour charts and above). If you attempt to use it on an incompatible timeframe, the script will provide a notification in the log rather than causing errors or incorrect data displays.
User Experience
When you apply this tool, it creates a structured "channel" on your screen. This allows you to see at a glance what the price range looked like during previous sessions, helping you identify support and resistance levels more efficiently. The lines are designed to be clean and unobtrusive, providing high-level data without cluttering your workspace.
ÿþ//+------------------------------------------------------------------+
//|                                                 DailyChannel.mq4 |
//|                        Copyright 2016, MetaQuotes Software Corp. |
//|                                             https://www.mql5.com |
//+------------------------------------------------------------------+
#property copyright "Copyright 2016, MetaQuotes Software Corp."
#property link      "https://www.mql5.com"
#property version   "1.00"
#property strict
#property indicator_chart_window
#property indicator_buffers 3
#property indicator_plots   3
//--- plot High
#property indicator_label1  "Highÿ"
#property indicator_type1   DRAW_LINE
#property indicator_color1  clrBlue
#property indicator_style1  STYLE_SOLID
#property indicator_width1  1
//--- plot Low
#property indicator_label2  "Lowÿ"
#property indicator_type2   DRAW_LINE
#property indicator_color2  clrRed
#property indicator_style2  STYLE_SOLID
#property indicator_width2  1
//--- plot Middle
#property indicator_label3  "Middleÿ"
#property indicator_type3   DRAW_LINE
#property indicator_color3  clrGreen
#property indicator_style3  STYLE_SOLID
#property indicator_width3  1
//--- input parameters
input int      LocalTimeZone=8;//Local Time Zone
input int      DailyTimeZone=-5;//Daily Time Zone Default UTC-5 East USA
input color     DailyPeriodColor=clrBlack;//Daily Period Color
input ENUM_LINE_STYLE     DailyPeriodStyle=STYLE_DOT;//Daily Period Style
const int CurrentPeriod=Period();
const string CurrentSymbol=Symbol();
//--- indicator buffers
double         HighBuffer[];
double         LowBuffer[];
double         MiddleBuffer[];
//+------------------------------------------------------------------+
//| Custom indicator initialization function                         |
//+------------------------------------------------------------------+
int OnInit()
  {
//--- indicator buffers mapping
   SetIndexBuffer(0,HighBuffer);
   SetIndexBuffer(1,LowBuffer);
   SetIndexBuffer(2,MiddleBuffer);
//--- name for DataWindow and indicator subwindow label
   string LocalTimeZoneString = (LocalTimeZone > 0) ? "+" +IntegerToString(LocalTimeZone): (LocalTimeZone < 0) ? IntegerToString(LocalTimeZone): "";
   string DailyTimeZoneString = (DailyTimeZone > 0) ? "+" +IntegerToString(DailyTimeZone):  (DailyTimeZone < 0) ? IntegerToString(DailyTimeZone): "";
   IndicatorShortName("DailyChannel("+IntegerToString(DailyTimeZone-LocalTimeZone)+")\n Local: UTC"+LocalTimeZoneString+"\n Daily : UTC"+DailyTimeZoneString);
//---
   if(CurrentPeriod>PERIOD_H1)
     {
      if(CurrentPeriod==PERIOD_H4)
        {
         if((DailyTimeZone-LocalTimeZone)%4!=0)
           {
            Print(__FUNCTION__,
                  ": Failed to initialization DailyChannel Indicator! Daily Time Zone UTC",DailyTimeZoneString,
                  " Local Time Zone UTC",LocalTimeZoneString," Time Difference ",DailyTimeZone-LocalTimeZone," Hours",
                  ",Show Indicator Period Best In 1 Hour (",PERIOD_H1,"Minutes)");
            return(INIT_FAILED);
           }
         else
           {
            return(INIT_SUCCEEDED);
           }
        }
      Print(__FUNCTION__,
            ": Failed to initialization DailyChannel Indicator! Show Indicator Period Best In 1 Hour (",PERIOD_H1,"Minutes)");
      return(INIT_FAILED);
     }
   return(INIT_SUCCEEDED);
  }
//+------------------------------------------------------------------+
//| Custom deinitialization function                                 |
//+------------------------------------------------------------------+
void OnDeinit(const int reason)
  {
//---
   ObjectsDeleteAll(0);
  }
//+------------------------------------------------------------------+
//| Custom indicator iteration function                              |
//+------------------------------------------------------------------+
int OnCalculate(const int rates_total,
                const int prev_calculated,
                const datetime &time[],
                const double &open[],
                const double &high[],
                const double &low[],
                const double &close[],
                const long &tick_volume[],
                const long &volume[],
                const int &spread[])
  {
//--- Get the number of bars available for the current symbol and chart period
//int bars=Bars(Symbol(),0);
//Print("Bars = ",bars,", rates_total = ",rates_total,",  prev_calculated = ",prev_calculated);
//Print("time[0] = ",time[0]," time[rates_total-1] = ",time[rates_total-1]);
   DailyChannel(rates_total,prev_calculated,time,open,high,low,close,tick_volume,volume,spread);
//--- return value of prev_calculated for next call
   return(rates_total);
  }
//+------------------------------------------------------------------+
//| DailyChannel                                                     |
//+------------------------------------------------------------------+
void DailyChannel(const int rates_total,// size of input time series
                  const int prev_calculated,// bars handled in previous call
                  const datetime &time[],
                  const double &open[],
                  const double &high[],
                  const double &low[],
                  const double &close[],
                  const long &tick_volume[],
                  const long &volume[],
                  const int &spread[])
  {
   datetime startDateTime=time[rates_total-1];
   datetime endDateTime=time[0];
   int limit; int  startShift=rates_total -1; int endShift=rates_total-1;
   for(limit=rates_total -1; limit>=0;limit--)
     {
      datetime limitDateTime=time[limit]+(DailyTimeZone-LocalTimeZone)*3600;
      string timeString=TimeToString(limitDateTime,TIME_MINUTES|TIME_SECONDS);
      if(timeString=="00:00:00")
        {
         if(ObjectGet("DailyChannel(Time Zone:"+IntegerToString(DailyTimeZone)+")"+TimeToString(limitDateTime),0))
           {
            VLineDelete(0,"DailyChannel(Time Zone:"+IntegerToString(DailyTimeZone)+")"+TimeToString(limitDateTime));
           }
         VLineCreate(0,"DailyChannel(Time Zone:"+IntegerToString(DailyTimeZone)+")"+TimeToString(limitDateTime),0,time[limit],DailyPeriodColor,DailyPeriodStyle,1,true,false);
         endShift=limit+1;
         int hightIndex=iHighest(CurrentSymbol,CurrentPeriod,MODE_HIGH,startShift-endShift+1,endShift);
         int lowIndex=iLowest(CurrentSymbol,CurrentPeriod,MODE_LOW,startShift-endShift+1,endShift);
         double highPrice= high[hightIndex];
         double lowPrice = low[lowIndex];
         initBuffer(startShift,endShift,highPrice,lowPrice);
         startShift=limit;
        }
     }
  }
//+------------------------------------------------------------------+
//| initialization Buffer                                            |
//+------------------------------------------------------------------+
void initBuffer(const int start,const int end,const double highPrice,const double lowPrice)
  {
   for(int limit=start;limit>=end;limit--)
     {
      HighBuffer[limit]= highPrice;
      LowBuffer[limit] = lowPrice;
      MiddleBuffer[limit]=(highPrice+lowPrice)/2;
     }
  }
//+------------------------------------------------------------------+
//| Create the vertical line                                         |
//+------------------------------------------------------------------+
bool VLineCreate(const long            chart_ID=0,        // chart's ID
                 const string          name="VLine",      // line name
                 const int             sub_window=0,      // subwindow index
                 datetime              time=0,            // line time
                 const color           clr=clrRed,        // line color
                 const ENUM_LINE_STYLE style=STYLE_SOLID, // line style
                 const int             width=1,           // line width
                 const bool            back=false,        // in the background
                 const bool            selection=true,    // highlight to move
                 const bool            ray=true,          // line's continuation down
                 const bool            hidden=true,       // hidden in the object list
                 const long            z_order=0)         // priority for mouse click
  {
//--- if the line time is not set, draw it via the last bar
   if(!time)
      time=TimeCurrent();
//--- reset the error value
   ResetLastError();
//--- create a vertical line
   if(!ObjectCreate(chart_ID,name,OBJ_VLINE,sub_window,time,0))
     {
      Print(__FUNCTION__,
            ": failed to create a vertical line! Error code = ",GetLastError());
      return(false);
     }
//--- set line color
   ObjectSetInteger(chart_ID,name,OBJPROP_COLOR,clr);
//--- set line display style
   ObjectSetInteger(chart_ID,name,OBJPROP_STYLE,style);
//--- set line width
   ObjectSetInteger(chart_ID,name,OBJPROP_WIDTH,width);
//--- display in the foreground (false) or background (true)
   ObjectSetInteger(chart_ID,name,OBJPROP_BACK,back);
//--- enable (true) or disable (false) the mode of moving the line by mouse
//--- when creating a graphical object using ObjectCreate function, the object cannot be
//--- highlighted and moved by default. Inside this method, selection parameter
//--- is true by default making it possible to highlight and move the object
   ObjectSetInteger(chart_ID,name,OBJPROP_SELECTABLE,selection);
   ObjectSetInteger(chart_ID,name,OBJPROP_SELECTED,selection);
//--- enable (true) or disable (false) the mode of displaying the line in the chart subwindows
   ObjectSetInteger(chart_ID,name,OBJPROP_RAY,ray);
//--- hide (true) or display (false) graphical object name in the object list
   ObjectSetInteger(chart_ID,name,OBJPROP_HIDDEN,hidden);
//--- set the priority for receiving the event of a mouse click in the chart
   ObjectSetInteger(chart_ID,name,OBJPROP_ZORDER,z_order);
//--- successful execution
   return(true);
  }
//+------------------------------------------------------------------+
//| Move the vertical line                                           |
//+------------------------------------------------------------------+
bool VLineMove(const long   chart_ID=0,   // chart's ID
               const string name="VLine", // line name
               datetime     time=0)       // line time
  {
//--- if line time is not set, move the line to the last bar
   if(!time)
      time=TimeCurrent();
//--- reset the error value
   ResetLastError();
//--- move the vertical line
   if(!ObjectMove(chart_ID,name,0,time,0))
     {
      Print(__FUNCTION__,
            ": failed to move the vertical line! Error code = ",GetLastError());
      return(false);
     }
//--- successful execution
   return(true);
  }
//+------------------------------------------------------------------+
//| Delete the vertical line                                         |
//+------------------------------------------------------------------+
bool VLineDelete(const long   chart_ID=0,   // chart's ID
                 const string name="VLine") // line name
  {
//--- reset the error value
   ResetLastError();
//--- delete the vertical line
   if(!ObjectDelete(chart_ID,name))
     {
      Print(__FUNCTION__,
            ": failed to delete the vertical line! Error code = ",GetLastError());
      return(false);
     }
//--- successful execution
   return(true);
  }
//+------------------------------------------------------------------+
Comments