_Correlation IND CHARTlite
Download script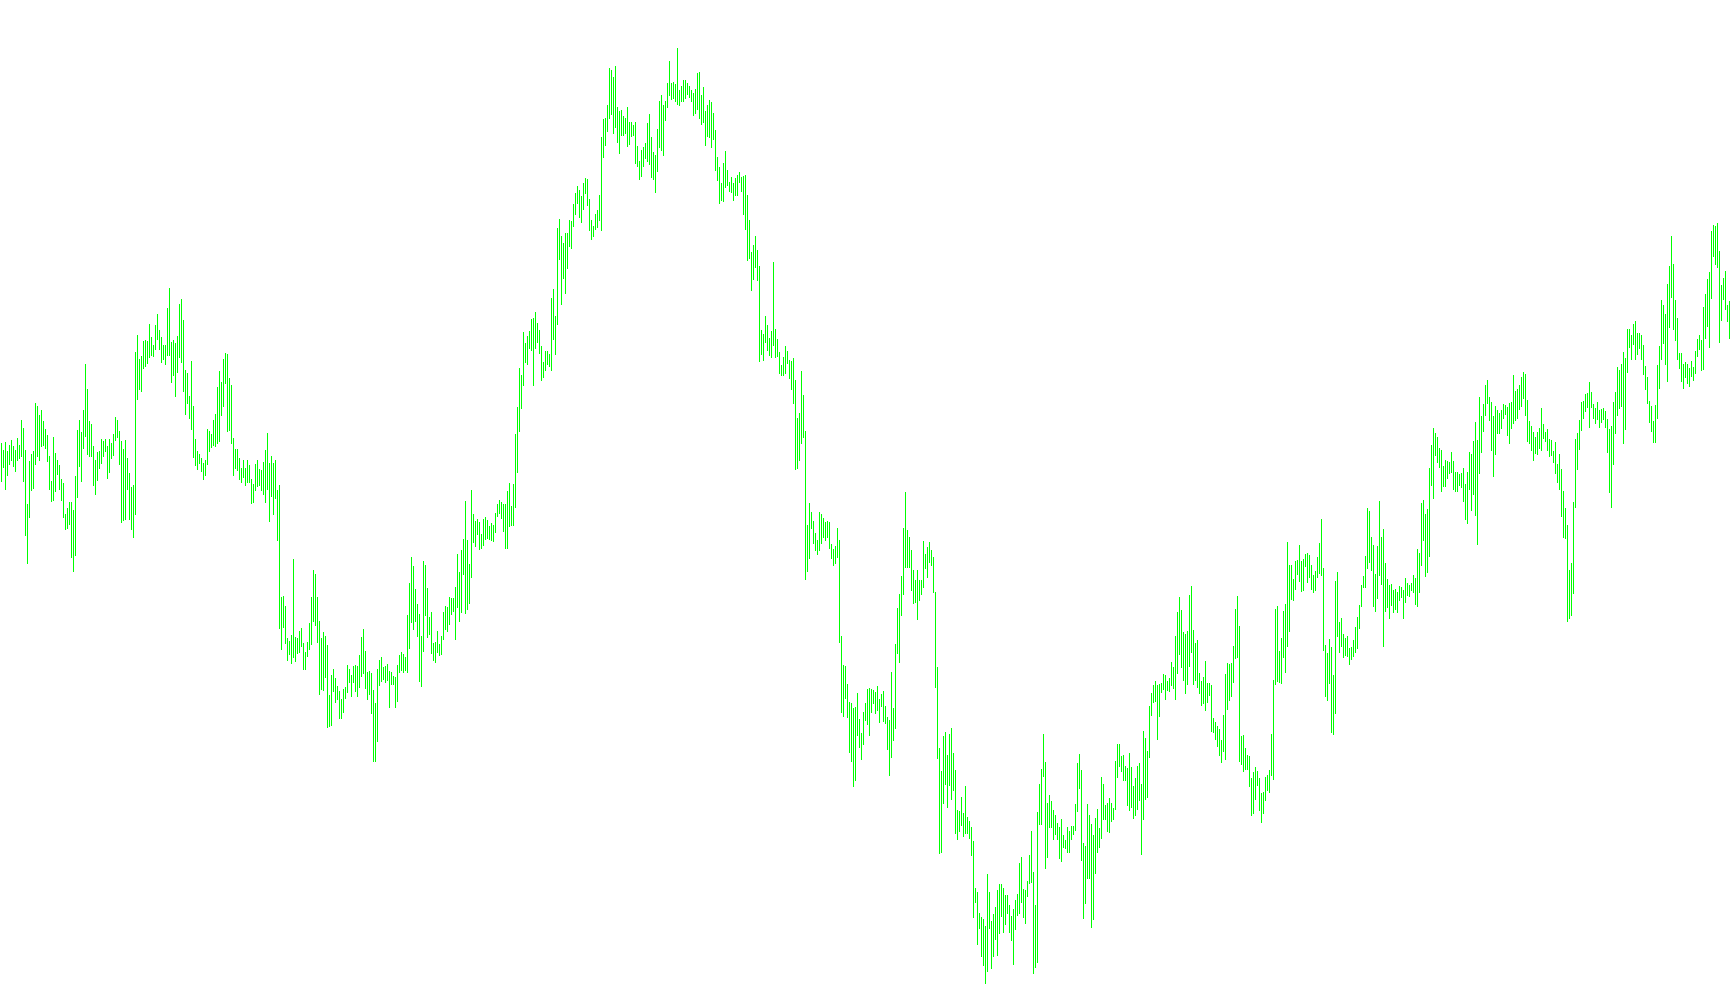
The Correlation Charting script is a visual analysis tool designed to help traders understand the relationship between different financial instruments simultaneously on a single chart. Instead of looking at multiple separate windows, this script projects the price movements of various symbols onto your main chart based on how they correlate with a primary "base" asset.
Core Functionality
The script allows you to track up to four different secondary symbols in relation to your current chart's symbol. By analyzing the historical price action of these external symbols, it calculates their relative movement and draws them as lines or histograms on your screen. This enables you to see "side-by-side" movements—for example, how a specific currency pair reacts compared to a commodity or another stock.
Key Logic Components
1. Correlation Mapping For each of the four symbols you choose to track, the script allows you to define the nature of the relationship:
- Positive Correlation: If a symbol moves in the same direction as your base asset, the script maps it so that its visual movement follows that same trend.
- Negative Correlation (Inverse): If a symbol moves in the opposite direction of your base asset, the script mirrors that logic, allowing you to visualize "inverse" relationships (where one goes up, the other goes down).
2. Dynamic Scaling and Adjustment Because different financial instruments have vastly different price values (for example, comparing a stock priced at $500 to one priced at $1.00), the script includes an adjustment percentage. This allows you to scale the movements of the secondary symbols so that they are visually comparable on the same chart area, ensuring that one high-value asset doesn't dwarf the movements of a lower-value one.
3. Visual Representation The script handles the heavy lifting of data calculation and presents it in several ways:
- Lines: Standard trend lines representing the price action of the correlated symbols.
- Histograms: Bars that can provide a different visual perspective on the magnitude of the price changes.
- Reference Labels: It automatically generates text labels on the chart to identify which line belongs to which symbol, keeping the workspace organized.
4. Automatic Time Alignment The script is designed to ensure that even if different symbols have slightly different trading hours or tick frequencies, it attempts to align their data points relative to your current chart's timeframe. It looks back at historical data to find matching time stamps, ensuring that the correlation you are seeing is synchronized correctly in time.
Summary for the User
In simple terms, this tool acts as a "multi-instrument overlay." It takes the price behavior of up to four other assets, adjusts their scale so they fit on your screen, and flips or mirrors them based on whether they move with or against your main chart. This helps you identify patterns, leading indicators, or diversification trends without having to flip back and forth between different tabs or windows.
//+------------------------------------------------------------------+
//|                                         Correlation Charting.mq4 |
//|                                Copyright © 2006, Nicholas Barker |
//|                                                  nick@barker.net |
//+------------------------------------------------------------------+
#property copyright "Copyright © 2006, Nicholas Barker"
#property link      "nick@barker.net"
//#include <WinUser32.mqh>
#property indicator_chart_window
#property indicator_buffers 8

extern string     symbol1           ="";
extern string     s1correlation     ="+";
extern color      s1color           =DarkOrchid;
extern int        TF                = 0;
extern double     s1adjust_percent  =100;
extern string     s2                ="";
extern string     s2cor             ="+";
extern double     s2adj             =100;
extern string     s3                ="";
extern string     s3cor             ="+";
extern double     s3adj             =100;
extern string     s4                ="";
extern string     s4cor             ="+";
extern double     s4adj             =100;
string s[4];
string cor[4];
double adj[4];
bool hasrun=false;
int  bar;
double base;
double base2[4];

double E1[];
double E2[];
double E3[];
double E4[];
double E5[];
double E6[];
double E7[];
double E8[];
//+------------------------------------------------------------------+
//| Custom indicator initialization function                         |
//+------------------------------------------------------------------+
int init()
  {

   if(StringFind(Symbol(),"m",0)>0){
      symbol1=symbol1+"m";
      s2=s2+"m";
      s3=s3+"m";
      s4=s4+"m";
   }
   s[0]=symbol1;
   s[1]=s2;
   s[2]=s3;
   s[3]=s4;
   cor[0]=s1correlation;
   cor[1]=s2cor;
   cor[2]=s3cor;
   cor[3]=s4cor;
   adj[0]=s1adjust_percent;
   adj[1]=s2adj;
   adj[2]=s3adj;
   adj[3]=s4adj;
   int wbpc=WindowBarsPerChart();
   if(wbpc>200)int size=2;
   else if (wbpc< 40)size=4;
   else size=3;
   SetIndexStyle(0,DRAW_LINE,0,0,DarkOrchid);
   SetIndexBuffer(0,E1);
   SetIndexStyle(1,DRAW_LINE,0,0,Crimson);
   SetIndexBuffer(1,E2);
   SetIndexStyle(2,DRAW_LINE,0,0,Pink);
   SetIndexBuffer(2,E3);
   SetIndexStyle(3,DRAW_LINE,0,0,Gold);
   SetIndexBuffer(3,E4);
   SetIndexStyle(4,DRAW_HISTOGRAM,0,1,s1color);
   SetIndexBuffer(4,E5);
   SetIndexStyle(5,DRAW_HISTOGRAM,0,1,s1color);
   SetIndexBuffer(5,E6);
   SetIndexStyle(6,DRAW_HISTOGRAM,0,size,s1color);
   SetIndexBuffer(6,E7);
   SetIndexStyle(7,DRAW_HISTOGRAM,0,size,s1color);
   SetIndexBuffer(7,E8);
  // Comment(a1,"  ",a2);
   return(0);
  }
//+------------------------------------------------------------------+
//| Custom indicator deinitialization function                       |
//+------------------------------------------------------------------+
int deinit()
  {
//----
   GlobalVariableSet(Symbol()+"CCIND",GlobalVariableGet(Symbol()+"CCIND")-1);
   //ObjectsDeleteAll();
   Comment("");
//----
   return(0);
  }
//+------------------------------------------------------------------+
//| Custom indicator iteration function                              |
//+------------------------------------------------------------------+
int start(){
   if(TF==0){
      if(hasrun){
         run();
      }else{
         runonce();
         hasrun=true;
      }
   }
   else runonce();
   return(0);
}
//+------------------------------------------------------------------+

void drawLine(double lvl,string name, color Col,int type){
   if(ObjectFind(name) != 0){
      ObjectCreate(name, OBJ_HLINE, 0, Time[0], lvl,Time[0],lvl);
      if(type == 1)
         ObjectSet(name, OBJPROP_STYLE, STYLE_SOLID);
      else
         ObjectSet(name, OBJPROP_STYLE, STYLE_DOT);
      ObjectSet(name, OBJPROP_COLOR, Col);
      ObjectSet(name,OBJPROP_WIDTH,1);
   }else{
      ObjectDelete(name);
      ObjectCreate(name, OBJ_HLINE, 0, Time[0], lvl,Time[0],lvl);
      if(type == 1)
         ObjectSet(name, OBJPROP_STYLE, STYLE_SOLID);
      else
         ObjectSet(name, OBJPROP_STYLE, STYLE_DOT);
      ObjectSet(name, OBJPROP_COLOR, Col);
      ObjectSet(name,OBJPROP_WIDTH,1);
   }
}
void drawLabel(string name,double lvl,color Color){
   if(ObjectFind(name) != 0){
      ObjectCreate(name, OBJ_TEXT, 0, Time[10], lvl);
      ObjectSetText(name, name, 8, "Arial", EMPTY);
      ObjectSet(name, OBJPROP_COLOR, Color);
   }
   else
   {
      ObjectMove(name, 0, Time[10], lvl);
   }
}
int runonce(){
   bar= WindowFirstVisibleBar();
   base= Close[bar];
   for(int y=0;y<4;y++)base2[y]=iClose(s[y],0,bar);
   int i;double change;
   int c;
   for(y=0;y<4;y++){
      if(StringLen(s[y])>2){
         c++;
      }
   }
   if(c<=1){
      for(i=bar;i>=0;i--){
         if(TF>0)int ss=i;
         else{
            datetime time = iTime(Symbol(),TF,i);
            ss = iBarShift(s[0],TF,time,false);
         }
         if(ss<0)continue;
         double highchange =  base2[0] - iHigh (s[0],TF,ss);
         double lowchange  =  base2[0] - iLow  (s[0],TF,ss);
         double openchange =  base2[0] - iOpen (s[0],TF,ss);
         double closechange=  base2[0] - iClose(s[0],TF,ss);
         highchange = highchange / MarketInfo(s[0],MODE_POINT);
         lowchange  = lowchange  / MarketInfo(s[0],MODE_POINT);
         openchange  = openchange  / MarketInfo(s[0],MODE_POINT);
         closechange  = closechange  / MarketInfo(s[0],MODE_POINT);
         if(cor[0]=="+"){
            E6[i]=base-(highchange*Point*(adj[0]/100));
            E5[i]=base-(lowchange*Point*(adj[0]/100));
            E7[i]=base-(openchange*Point*(adj[0]/100));
            E8[i]=base-(closechange*Point*(adj[0]/100));
         }else {
            E6[i]=base+(highchange*Point*(adj[0]/100));
            E5[i]=base+(lowchange*Point*(adj[0]/100));
            E7[i]=base+(openchange*Point*(adj[0]/100));
            E8[i]=base+(closechange*Point*(adj[0]/100));
         }
      }
      drawLine(E8[0],s[0]+" Price", s1color,1);
      drawLabel(s[0],E8[0],s1color);
      return(0);
   }
   if(StringLen(s[0])>2){
      for(i=bar-1;i>=0;i--){
         change = base2[0] - iClose(s[0],0,i);
         change = change / MarketInfo(s[0],MODE_POINT);
         if(cor[0]=="+"){
            E1[i]=base-(change*Point*(adj[0]/100));
         }else {
            E1[i]=base+(change*Point*(adj[0]/100));
         }
      }
   }
   if(StringLen(s[1])>2){
      for(i=bar-1;i>=0;i--){
         change = base2[1] - iClose(s[1],0,i+1);
         change = change / MarketInfo(s[1],MODE_POINT);
         if(cor[1]=="+"){
            E2[i]=base-(change*Point*(adj[1]/100));
         }else {
            E2[i]=base+(change*Point*(adj[0]/100));
         }
      }
   }
   if(StringLen(s[2])>2){
      for(i=bar-1;i>=0;i--){
         change = base2[2] - iClose(s[2],0,i+1);
         change = change / MarketInfo(s[2],MODE_POINT);
         if(cor[2]=="+"){
            E3[i]=base-(change*Point*(adj[2]/100));
         }else {
            E3[i]=base+(change*Point*(adj[2]/100));
         }
      }
   }
   if(StringLen(s[3])>2){
      for(i=bar-1;i>=0;i--){
         change = base2[3] - iClose(s[3],0,i+1);
         change = change / MarketInfo(s[3],MODE_POINT);
         if(cor[3]=="+"){
            E4[i]=base-(change*Point*(adj[3]/100));
         }else {
            E4[i]=base+(change*Point*(adj[3]/100));
         }
      }
   }
   return(0);
}

int run(){
   int i=0;double change;int c;
   for(int y=0;y<4;y++){
      if(StringLen(s[y])>2){
         c++;
      }
   }
   if(c<=1){
         double highchange = base2[0] - iHigh(s[0],TF,i);
         double lowchange  = base2[0] - iLow(s[0],TF,i);
         double openchange=  base2[0] - iOpen(s[0],TF,i);
         double closechange=  base2[0] - iClose(s[0],TF,i);
         highchange = highchange / MarketInfo(s[0],MODE_POINT);
         lowchange  = lowchange  / MarketInfo(s[0],MODE_POINT);
         openchange  = openchange  / MarketInfo(s[0],MODE_POINT);
         closechange  = closechange  / MarketInfo(s[0],MODE_POINT);
         if(cor[0]=="+"){
            E6[i]=base-(highchange*Point*(adj[0]/100));
            E5[i]=base-(lowchange*Point*(adj[0]/100));
            E7[i]=base-(openchange*Point*(adj[0]/100));
            E8[i]=base-(closechange*Point*(adj[0]/100));
         }else {
            E6[i]=base+(highchange*Point*(adj[0]/100));
            E5[i]=base+(lowchange*Point*(adj[0]/100));
            E7[i]=base+(openchange*Point*(adj[0]/100));
            E8[i]=base+(closechange*Point*(adj[0]/100));
         }
         drawLine(E8[0],s[0]+" Price", s1color,1);
         drawLabel(s[0],E8[0],s1color);
      return(0);
   }
   if(StringLen(s[0])>2){

         change = base2[0] - iClose(s[0],0,i);
         change = change / MarketInfo(s[0],MODE_POINT);
         if(cor[0]=="+"){
            E1[i]=base-(change*Point*(adj[0]/100));
         }else {
            E1[i]=base+(change*Point*(adj[0]/100));
         }

   }
   if(StringLen(s[1])>2){

         change = base2[1] - iClose(s[1],0,i);
         change = change / MarketInfo(s[1],MODE_POINT);
         if(cor[1]=="+"){
            E2[i]=base-(change*Point*(adj[1]/100));
         }else {
            E2[i]=base+(change*Point*(adj[0]/100));
         }

   }
   if(StringLen(s[2])>2){
//      for(i=bar-1;i>=0;i--){
         change = base2[2] - iClose(s[2],0,i);
         change = change / MarketInfo(s[2],MODE_POINT);
         if(cor[2]=="+"){
            E3[i]=base-(change*Point*(adj[2]/100));
         }else {
            E3[i]=base+(change*Point*(adj[2]/100));
         }
  //    }
   }
   if(StringLen(s[3])>2){
//      for(i=bar-1;i>=0;i--){
         change = base2[3] - iClose(s[3],0,i);
         change = change / MarketInfo(s[3],MODE_POINT);
         if(cor[3]=="+"){
            E4[i]=base-(change*Point*(adj[3]/100));
         }else {
            E4[i]=base+(change*Point*(adj[3]/100));
         }
//      }
   }
   return(0);
}
Comments