BrainTrend1_all_in_one
Download script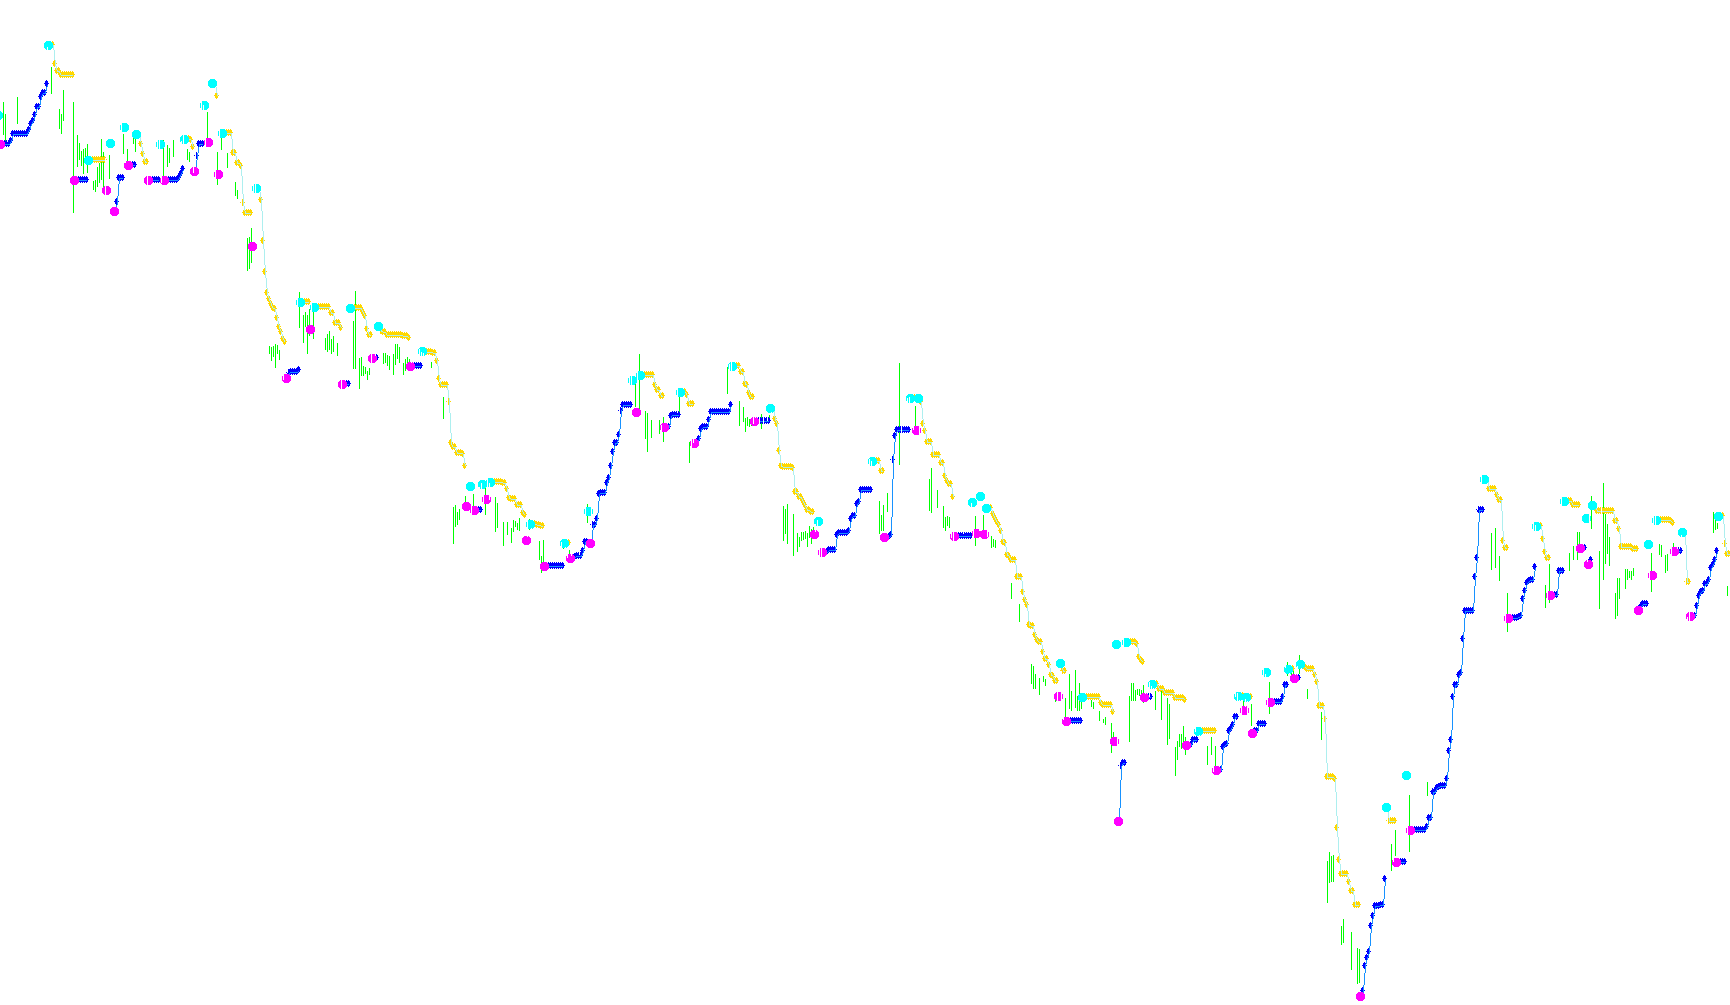
Overview
The BrainTrend1-all-in-one tool is a comprehensive technical analysis indicator designed to simplify market trend visualization. Instead of requiring several different tools to be loaded onto a trading chart, this script consolidates four distinct components into a single, cohesive display. It focuses on identifying price momentum, detecting significant "shocks" in the market (rapid moves), and highlighting current trend directions through various visual cues like dots, lines, arrows, and histograms.
Core Logic & Mechanics
The tool operates by analyzing three primary data points: Volatility (how much the price is moving), Momentum (the speed of the price change), and Price Action (the actual movement between consecutive bars).
1. Detecting Market "Shocks"
The script constantly monitors for sudden, aggressive moves in price. It does this by comparing the current price change against a normalized volatility average (ATR).
- Rapid Drops: If the price falls quickly and the momentum is at a low level, the system identifies a potential "Sell" scenario.
- Rapid Rises: If the price climbs quickly and the momentum is at a high level, the system identifies a potential "Buy" scenario.
When these rapid movements occur, the indicator places specific Signal Arrows on the chart to alert the user to the sudden shift in market energy.
2. Trend Tracking and Stop Levels
Beyond just identifying sudden jumps, the script tracks the ongoing trend to help traders determine where a move might exhaust itself.
- Dynamic Support/Resistance Lines: The tool calculates "Stop" levels based on price highs and lows combined with volatility factors. These appear as lines on your chart.
- Continuous Tracking: If the market is not experiencing a sudden shock, the script continues to monitor the "best" available price points. It updates these dots and lines dynamically, effectively showing you where the "ceiling" or "floor" of the current trend lies.
3. Trend Visualization (Histogram)
To provide a clear, at-a-glance view of the market's direction, the script uses a background histogram logic:
- Down Trend: When price momentum is weak and volatility suggests a downward bias, it colors the bars to reflect a bearish environment.
- Up Trend: Conversely, when momentum is strong and bullish, it highlights the bars to indicate an upward trend.
Summary of Visual Outputs
To make this information easy for a trader to read, the script translates these calculations into four distinct visual elements:
- Dots and Lines: Represent ongoing price boundaries and "Stop" levels.
- Arrows: Act as immediate alerts for sharp, high-momentum price shocks.
- Histograms: Provide a continuous visual "map" of whether the current market sentiment is trending up or down.
By combining these elements, the script allows you to see the current trend, identify volatility boundaries, and spot sudden momentum shifts all in one unified view.
//+------------------------------------------------------------------+
//|                                       BrainTrend1-all-in-one.mq4 |
//|                                     BrainTrading Inc. System 7.0 |
//|                                      http://www.braintrading.com |
//|                             Modified by Serge skhorouji@gmail.com|
//+------------------------------------------------------------------+
/* Serge: This indicator includes all 4 original BrainTrend1 indicators as I am 2 lazy to apply
   them all one by one on a chart:
   BrainTrend1Stop, BrainTrend1StopLine, BrainTrend1Sig, TrainTrend1.
   It has customised external variables that can be played with during optimisation
   Also I renamed variables, simplified & logically re-arranged the codes of the original indicators
   to make them more understandable (I mean for myself :-)
*/

#property copyright "Copyright © 2005, MetaQuotes Software Corp."
#property link      "http://www.braintrading.comt"

#property indicator_chart_window
#property indicator_buffers 8
#property indicator_color1 Magenta
#property indicator_color2 Aqua
#property indicator_color3 Magenta
#property indicator_color4 Aqua
#property indicator_color5 Magenta
#property indicator_color6 Aqua
#property indicator_color7 Magenta
#property indicator_color8 Aqua

//---- input parameters
extern   double    stoch_period=9;
extern   double    stoch_max=53;
extern   double    stoch_min=47;
extern   double    atr_current_norm_factor=0.435;
extern   double    atr_before_norm_factor=1.5;
extern   double    atr_period=7;
extern   int       atr_before_step=1;
extern   int       NumBars=10000;   //If you want to display ALL indicator values, set this to 0 - will use more memory of cause

//---- buffers
double sell_stop_dot_buf[];   //Sell stop dots, aka BrainTrend1Stop
double buy_stop_dot_buf[];    //Buy stop dots
double sell_stop_line_buf[];  //Sell stop line
double buy_stop_line_buf[];   //Buy stop line
double sell_signal_buf[];     //Sell signal dots
double buy_signal_buf[];      //Buy signal dots
double down_buf[];            //Down trend bars
double up_buf[];              //Up trend bars

int init()
{  SetIndexStyle(0,DRAW_ARROW);
   SetIndexArrow(0,115);
   SetIndexBuffer(0,sell_stop_dot_buf);
   SetIndexLabel(0,"sell_stop_dot");
   SetIndexEmptyValue(0, EMPTY_VALUE);
   SetIndexStyle(1,DRAW_ARROW);
   SetIndexArrow(1,115);
   SetIndexBuffer(1,buy_stop_dot_buf);
   SetIndexLabel(1,"buy_stop_dot");
   SetIndexEmptyValue(1, EMPTY_VALUE);
   SetIndexStyle(2,DRAW_LINE);
   SetIndexBuffer(2,sell_stop_line_buf);
   SetIndexLabel(2,"sell_stop_line");
   SetIndexEmptyValue(2, EMPTY_VALUE);
   SetIndexStyle(3,DRAW_LINE);
   SetIndexBuffer(3,buy_stop_line_buf);
   SetIndexLabel(3,"buy_stop_line");
   SetIndexEmptyValue(3, EMPTY_VALUE);
   SetIndexStyle(4,DRAW_ARROW);
   SetIndexArrow(4,108);
   SetIndexBuffer(4,sell_signal_buf);
   SetIndexLabel(4,"sell_signal");
   SetIndexEmptyValue(4, EMPTY_VALUE);
   SetIndexStyle(5,DRAW_ARROW);
   SetIndexArrow(5,108);
   SetIndexBuffer(5,buy_signal_buf);
   SetIndexLabel(5,"buy_signal");
   SetIndexEmptyValue(5, EMPTY_VALUE);
   SetIndexStyle(6,DRAW_HISTOGRAM);
   SetIndexBuffer(6,down_buf);
   SetIndexLabel(6,"down_trend");
   SetIndexStyle(7,DRAW_HISTOGRAM);
   SetIndexBuffer(7,up_buf);
   SetIndexLabel(7,"up_trend");
}

int start()
{  double    stoch_current,
             atr_current_normalised,
             atr_before_normalised;
   double    value3,value4,value5,
             val1,val2,
             close_diff, r;
   int       flag1, flag2; //flags=1 when pair drops down quickly.  Stoch is below stoch_min and diff in Closes exceeds atr_current_normalised.
                           //flags=2 when pair goes up quickly. Stoch is above stoch_max and diff in Closes exceeds atr_current_normalised.

   if (NumBars == 0)
      int shift = Bars - MathMax(stoch_period,atr_period);
   else
      shift = MathMax(Bars,NumBars) - MathMax(stoch_period,atr_period);

   while(shift>=0)
   {  atr_current_normalised = iATR(NULL,0,atr_period,shift)*atr_current_norm_factor;
      atr_before_normalised = atr_before_norm_factor*iATR(NULL,0,atr_period+atr_before_step,shift);
      stoch_current = iStochastic(NULL,0,stoch_period,stoch_period,1,0,0,0,shift);
      val1 = 0; val2 = 0;
      value4 = High[shift] + atr_before_normalised;
      value5 = Low[shift] - atr_before_normalised;
      close_diff = MathAbs(Close[shift] - Close[shift + 2]);

      //Process Sharp Drops & Rises
      if (close_diff > atr_current_normalised)
         if (stoch_current < stoch_min && flag1 != 1 )      //pair drops down quickly
         {  value3 = High[shift] + atr_before_normalised/4;
            flag1 = 1;
            val1 = value3;
            r = value3;
            sell_signal_buf[shift]=value3;
            sell_stop_line_buf[shift]=value3;
         }
         else if (stoch_current > stoch_max && flag1 != 2 )  //pair goes up quickly
         {  value3 = Low[shift] - atr_before_normalised/4;
            flag1 = 2;
            val2 = value3;
            r = value3;
            buy_signal_buf[shift]=value3;
            buy_stop_line_buf[shift]=value3;
         }

      //Process small Drops & Rises
      if (val1 == 0 && val2 == 0) //
         switch(flag1)
         {  case 1:
               if (value4 < r)
               {  r = value4;
               }
               sell_stop_dot_buf[shift]=r;
               sell_stop_line_buf[shift]=r;
               break;
            case 2:
               if (value5 > r)
               {  r = value5;
               }
               buy_stop_dot_buf[shift]=r;
               buy_stop_line_buf[shift]=r;
               break;
         }

      //------This piece of code calculates BrainTrend1 params and draws them as histogram
      if ( close_diff > atr_current_normalised )
      {  if (stoch_current < stoch_min)
            flag2 = 1;
         else if (stoch_current > stoch_max)
            flag2 = 2;
      }

      if ( (stoch_current < stoch_min && flag2 == 1) || (stoch_current < stoch_min && flag2 == 0)  )
      {  if ( close_diff > atr_current_normalised )
         {  down_buf[shift] = High[shift];
            up_buf[shift] = Low[shift];
         }
      }
      else if ( (stoch_current > stoch_max && flag2 == 2) || (stoch_current > stoch_max && flag2 == 0) )
      {  up_buf[shift] = High[shift];
         down_buf[shift] = Low[shift];
      }
      //------------------------------------------
      shift--;
   }
}
Comments