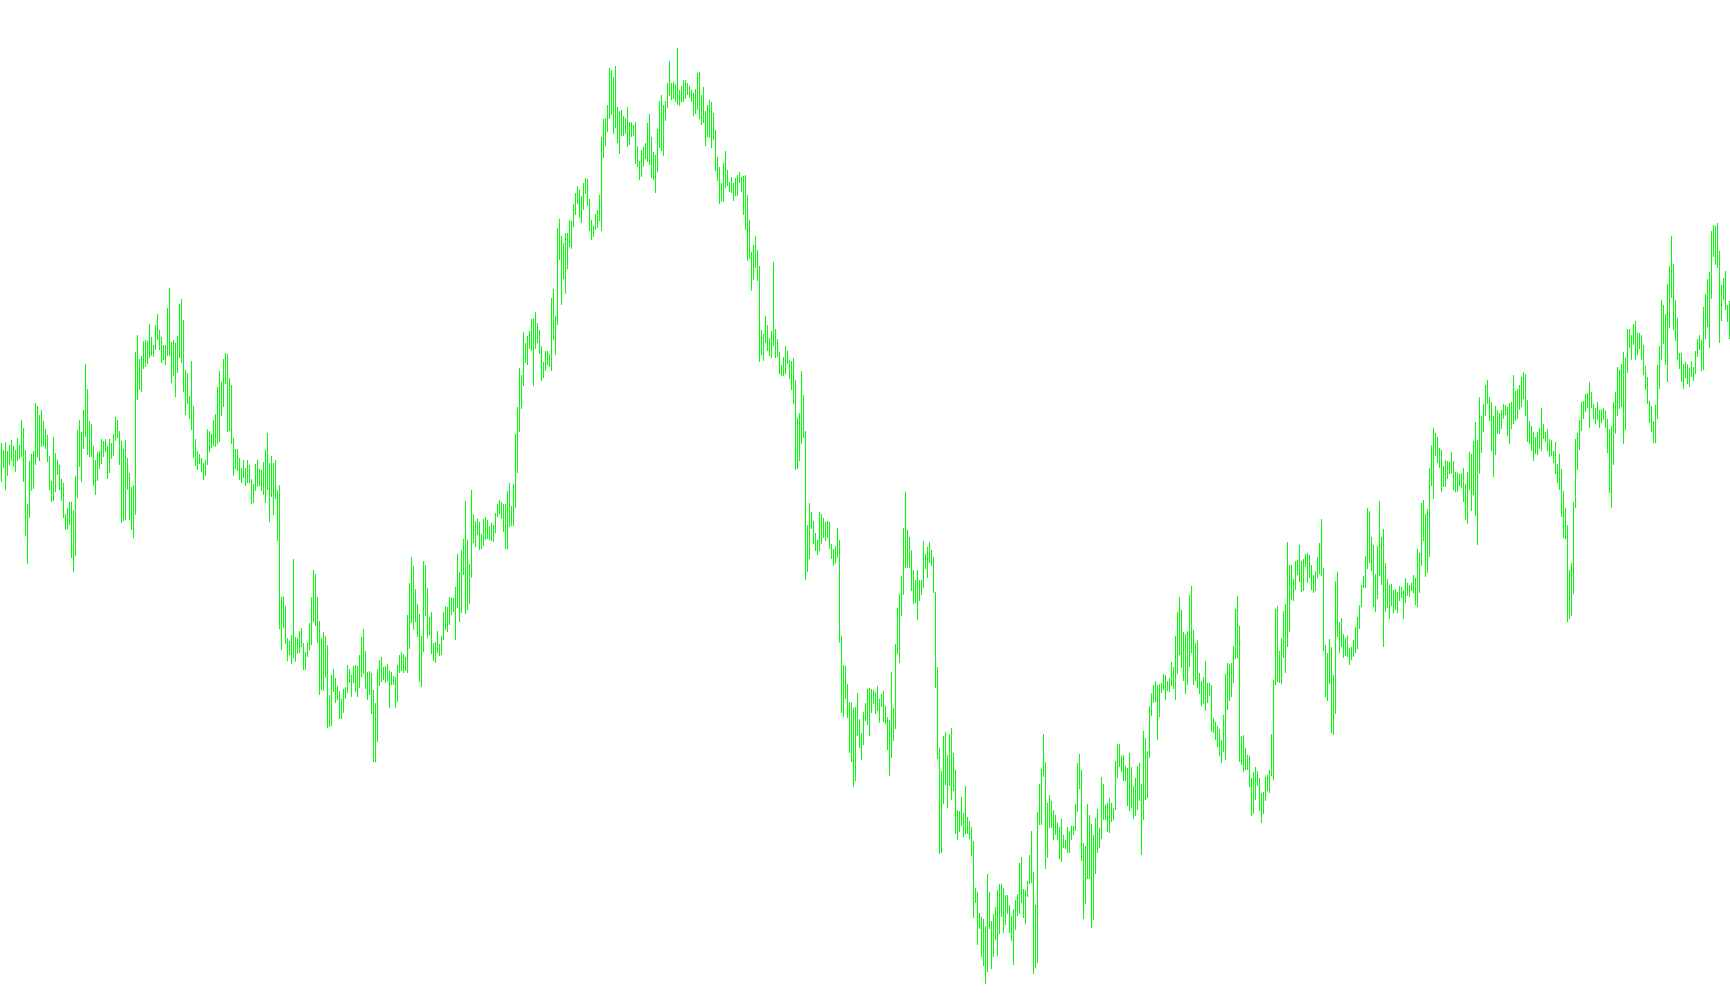
This script is a specialized visual tool designed specifically for use within the MetaTrader Strategy Tester. Its primary purpose is to project "future" price data onto your chart during backtesting, allowing you to see what price actions occur ahead of the current point in time.
Core Logic and Behavior
Visualization in Backtesting The script is built to function only in the visualization mode of the strategy tester. It takes current market data and projects it forward by a user-defined number of bars (the "Future" parameter). This helps traders visualize the upcoming price movement more clearly during historical simulations.
Multi-Timeframe Analysis The logic works by analyzing price data from a higher timeframe relative to the one you are currently viewing. It identifies specific timeframes (such as converting Hourly data into 30-minute segments, or Daily data into 4-hour segments) to ensure that the projected "future" bars are calculated based on consistent historical movements.
Price Projection Mechanism For each of the projected future bars, the script calculates four specific price points:
- Open and Close Prices: It determines the starting and ending values for each bar.
- High and Low Points: It scans for the extreme peaks and valleys within those time segments to define the boundaries of the move.
Dynamic Adjustments The script automatically adjusts how it interprets these price points based on whether a candle was bullish (closing higher than it opened), bearish (closing lower than it opened), or neutral (flat). This ensures that the visual "histograms" accurately reflect the direction and intensity of the projected price movement.
Key Requirements for Use
- Tester Only: This is not intended for live trading; it is a specialized tool for analyzing backtest results.
- Timeframe Restriction: It is designed to work on timeframes of 5 minutes or higher.
- Customization: Users can define how many bars into the future they want to see projected and can toggle specific color schemes for better visibility.
//+------------------------------------------------------------------+
//|                                                 BackToFuture.mq4 |
//|                                                      Denis Orlov |
//|                                    http://denis-or-love.narod.ru |
/*
Èíäèêàòîð Íàçàä Â Áóäóùåå ðèñóåò â òåñòåðå ïðåäñòîÿùèå áàðû çàðàíåå...

Îïèñàíèå:
Ðàáîòàåò òîëüêî â òåñòåðå, â ðåæèìå âèçóàëèçàöèè è íà òàéìôðåéìå íå ìåíåå 5M.
Ïîáðîáíî:
http://codebase.mql4.com/ru/6305

The indicator Back In the Future draws forthcoming bars  in a tester, in advance...

The description:
Works only in a tester, in a mode of visualisation and on timeframe not less 5M.
In detail:
http://codebase.mql4.com/6306


*/
//+------------------------------------------------------------------+
#property copyright "Denis Orlov"
#property link      "http://denis-or-love.narod.ru"


#property indicator_chart_window
#property indicator_buffers 4
#property indicator_color1 Turquoise
#property indicator_color2 Blue
#property indicator_color3 Turquoise
#property indicator_color4 Blue

extern int Future=30;
extern bool GoldColor=False;

double Line1[], Line2[], Line3[], Line4[];


//+------------------------------------------------------------------+
//| Custom indicator initialization function                         |
//+------------------------------------------------------------------+
int init()
  {
//---- indicators
      if(Future<0) Future=0;

   SetIndexStyle(0,DRAW_HISTOGRAM,0,3);
   SetIndexBuffer(0,Line1);
   SetIndexShift( 0, Future);

   SetIndexStyle(1,DRAW_HISTOGRAM,0,3);
   SetIndexBuffer(1,Line2);
   SetIndexShift( 1, Future);

   SetIndexStyle(2,DRAW_HISTOGRAM,0,1);
   SetIndexBuffer(2,Line3);
   SetIndexShift( 2, Future);

   SetIndexStyle(3,DRAW_HISTOGRAM,0,1);
   SetIndexBuffer(3,Line4);
   SetIndexShift( 3, Future);

   if(GoldColor)
      {
         SetIndexStyle(0,DRAW_HISTOGRAM,0,3,Yellow);
         SetIndexStyle(1,DRAW_HISTOGRAM,0,3,Orange);
         SetIndexStyle(2,DRAW_HISTOGRAM,0,1,Yellow);
         SetIndexStyle(3,DRAW_HISTOGRAM,0,1,Orange);
      }
//----
   return(0);
  }
//+------------------------------------------------------------------+
//| Custom indicator deinitialization function                       |
//+------------------------------------------------------------------+
int deinit()
  {
//----

//----
   return(0);
  }
//+------------------------------------------------------------------+
//| Custom indicator iteration function                              |
//+------------------------------------------------------------------+
int start()
  {
  if (Period()<5) return;

  static int per;
  if (per == Time[0]) return; // îäèí ðàç â áàð
    per = Time[0];

   //int    counted_bars=IndicatorCounted();

       int pTF=PrevPer(Period());
    int iB=iBarShift(NULL,pTF, per);
    if(iB==0) return;

    int K=MathRound(Period()/pTF);

    //Comment(TimeToStr(per)+";"+iBarShift(NULL,0, per-3000, true)+"\n"+
           // TimeToStr(TimeCurrent())+";"+iBarShift(NULL,0, TimeCurrent()-3000, true));


   ArrayInitialize( Line1, EMPTY_VALUE);
   ArrayInitialize( Line2, EMPTY_VALUE);
   ArrayInitialize( Line3, EMPTY_VALUE);
   ArrayInitialize( Line4, EMPTY_VALUE);

   iB=iB-K+1;//ïîñëåäíèé áàð íèçøåãî ïåðèîäà îò 0 áàðà òåêóùåãî

   for(int i=Future-1; i>=0;i--)
      {

        iB=iB-K; //ïîñëåäíèé áàð íèçøåãî ïåðèîäà îò i áàðà òåêóùåãî

          double

           H=iHigh(NULL, pTF,iHighest( NULL ,pTF, MODE_HIGH, K, iB) ),
           L=iLow(NULL, pTF,iLowest( NULL ,pTF, MODE_LOW, K, iB)),
           O=iOpen(NULL, pTF,iB+K-1),//ïåðâûé áàð íèçøåãî ïåðèîäà îò i áàðà òåêóùåãî
           C=iClose(NULL, pTF,iB);

          // H=iHigh(Symbol(), Period(),iB-Future+i),
          // L=iLow(Symbol(), Period(),iB-Future+i),
          // O=iOpen(Symbol(), Period(),iB-Future+i),
         //  C=iClose(Symbol(), Period(),iB-Future+i);

           if(C>O)
            {
               Line1[i]=C; Line2[i]=O;
               Line3[i]=H; Line4[i]=L;
            }
            else
            if(C<O)
            {
               Line1[i]=C; Line2[i]=O;
               Line3[i]=L; Line4[i]=H;
            }
            else
            if(C==O)
            {
               Line1[i]=O; Line2[i]=C+0.01*Point;
               Line3[i]=L; Line4[i]=H;
            }

      }


//----

//----
   return(0);
  }
//+------------------------------------------------------------------+
int PrevPer(int Per)
   {
      switch(Per)                 // Ðàñ÷¸ò  äëÿ..
      {                              // .. ðàçëè÷íûõ ÒÔ
      case     1: return(1); break;// Òàéìôðåéì Ì1
      case     5: return(1); break;// Òàéìôðåéì Ì5
      case    15: return(5); break;// Òàéìôðåéì Ì15
      case    30: return(15); break;// Òàéìôðåéì Ì30
      case    60: return(30); break;// Òàéìôðåéì H1
      case   240: return(60); break;// Òàéìôðåéì H4
      case  1440: return(240); break;// Òàéìôðåéì D1
      case 10080: return(1440); break;// Òàéìôðåéì W1
      case 43200: return(10080); break;// Òàéìôðåéì ÌN
      }
   }
Comments