aku_rapopo
Download script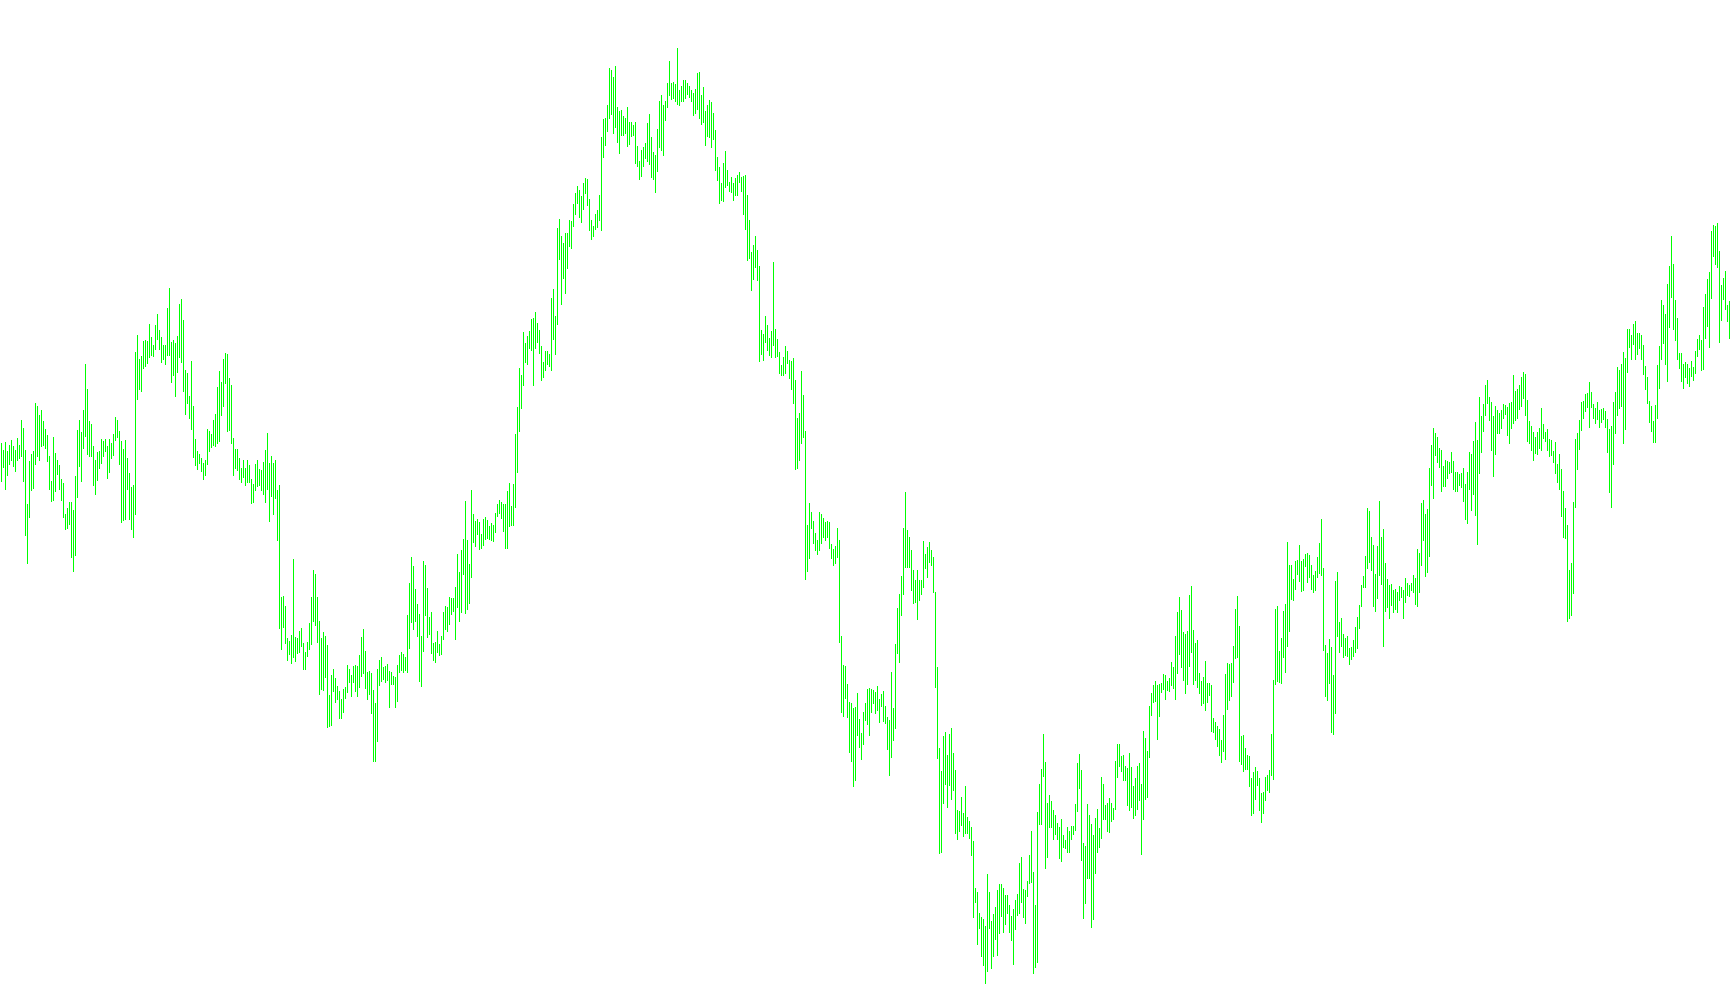
This tool is designed as a visual market analysis indicator for the MetaTrader platform. Its primary purpose is to automatically identify key structural price levels on your chart, helping traders visualize potential supply and demand zones based on historical price movement.
Instead of looking at single price points, the script analyzes a specific "lookback" window of recent price data (defined by the user) to determine the boundaries of the current market range. Here is how the logic breaks down:
Key Components of the Analysis
-
Dynamic Range Identification: The tool scans the historical data to find the highest peak (Resistance) and the lowest valley (Support) within a set period. These two points serve as the "ceiling" and "floor" of the current market price action.
-
Market Equilibrium (Middle Line): Once the high and low points are established, the script calculates the exact midpoint between them. This represents the neutral zone or the balance point of the market, where neither buyers nor sellers have a clear dominance.
-
Supply and Demand Zones (Balance Lines): The script further divides the space between the high and low into quarters. It generates two specific lines:
- Buyer Balance: Located at the upper quarter of the range.
- Seller Balance: Located at the lower quarter of the range.
How it Assists Traders
By plotting these five distinct lines on your chart, the script transforms raw price data into a structured visual map:
- Identifying Boundaries: You can clearly see where the price has historically struggled to move higher (Resistance) or lower (Support).
- Zone Awareness: The "Balance" lines provide a more nuanced view than just the highs and lows, showing you where the market might shift from a state of balance into a trending movement.
- Visual Organization: Because these levels are calculated automatically based on the price period you choose, they adjust dynamically as new price data enters the chart, ensuring your analysis remains relevant to current market conditions.
//+------------------------------------------------------------------+
//|                                                   Aku Rapopo.mq4 |
//|                              Copyright © 2014, Slamet Hardiyanto |
//|                                                                  |
//+------------------------------------------------------------------+
#property copyright "Copyright © 2014, Slamet Hardiyanto"
#property link      "http://Aku Rapopo.Com/"

//---- indicator settings
#property  indicator_chart_window
#property  indicator_buffers 5
#property  indicator_color1  Blue
#property  indicator_color2  Red
#property  indicator_color3  Yellow
#property  indicator_color4  White
#property  indicator_color5  Yellow
#property  indicator_width1  2
#property  indicator_width2  2
#property  indicator_width3  2
#property  indicator_width4  2
#property  indicator_width5  2

//---- indicator parameters
extern int Start=0;
extern int Periode=96;

//---- indicator buffers
double     ResistanceBuffer[];
double     BuyerBallanceBuffer[];
double     MidleBuffer[];
double     SellerBallanceBuffer[];
double     SupportBuffer[];

//+------------------------------------------------------------------+
//| Custom indicator initialization function                         |
//+------------------------------------------------------------------+
int init()
  {
//---- drawing settings
   SetIndexStyle(0,DRAW_LINE);
   SetIndexStyle(1,DRAW_LINE);
   SetIndexStyle(2,DRAW_LINE);
   SetIndexStyle(3,DRAW_LINE);
   SetIndexStyle(4,DRAW_LINE);
   SetIndexDrawBegin(1,Periode+Start);
   IndicatorDigits(Digits);
//---- indicator buffers mapping
   SetIndexBuffer(0,ResistanceBuffer);
   SetIndexBuffer(1,SupportBuffer);
   SetIndexBuffer(2,BuyerBallanceBuffer);
   SetIndexBuffer(3,MidleBuffer);
   SetIndexBuffer(4,SellerBallanceBuffer);
//---- name for DataWindow and indicator subwindow label
   IndicatorShortName("Level Period: "+Periode);
   SetIndexLabel(0,"Resistance");
   SetIndexLabel(1,"BuyerBallance");
   SetIndexLabel(2,"Midle");
   SetIndexLabel(3,"SellerBallance");
   SetIndexLabel(4,"Support");
//---- initialization done
   return(0);
  }
//+------------------------------------------------------------------+
//| Level Statis                                                     |
//+------------------------------------------------------------------+
int start()
  {
   int limit;
   int counted_bars=IndicatorCounted();
//---- last counted bar will be recounted
   if(counted_bars>0) counted_bars--;
   limit=Bars-counted_bars;
//---- Resistance line counted in the 1-st buffer
   for(int i=0; i<limit; i++)
      ResistanceBuffer[i]=High[iHighest(NULL,0,MODE_HIGH,Periode,Start+i)];
//---- Suport line counted in the 2-nd buffer
   for(i=0; i<limit; i++)
      SupportBuffer[i]=Low[iLowest(NULL,0,MODE_LOW,Periode,Start+i)];
//---- BuyerBallance line counted in the 3-rd buffer
   for(i=0; i<limit; i++)
      BuyerBallanceBuffer[i]=ResistanceBuffer[i]-((ResistanceBuffer[i]-SupportBuffer[i])/4);
//---- Midle line counted in the 4-rd buffer
   for(i=0; i<limit; i++)
      MidleBuffer[i]=((ResistanceBuffer[i]-SupportBuffer[i])/2)+SupportBuffer[i];
//---- SellerBallance line counted in the 5-rd buffer
   for(i=0; i<limit; i++)
      SellerBallanceBuffer[i]=((ResistanceBuffer[i]-SupportBuffer[i])/4)+SupportBuffer[i];
//---- done
   return(0);
  }
//+------------------------------------------------------------------+
Comments