Aggressiveness2
Download script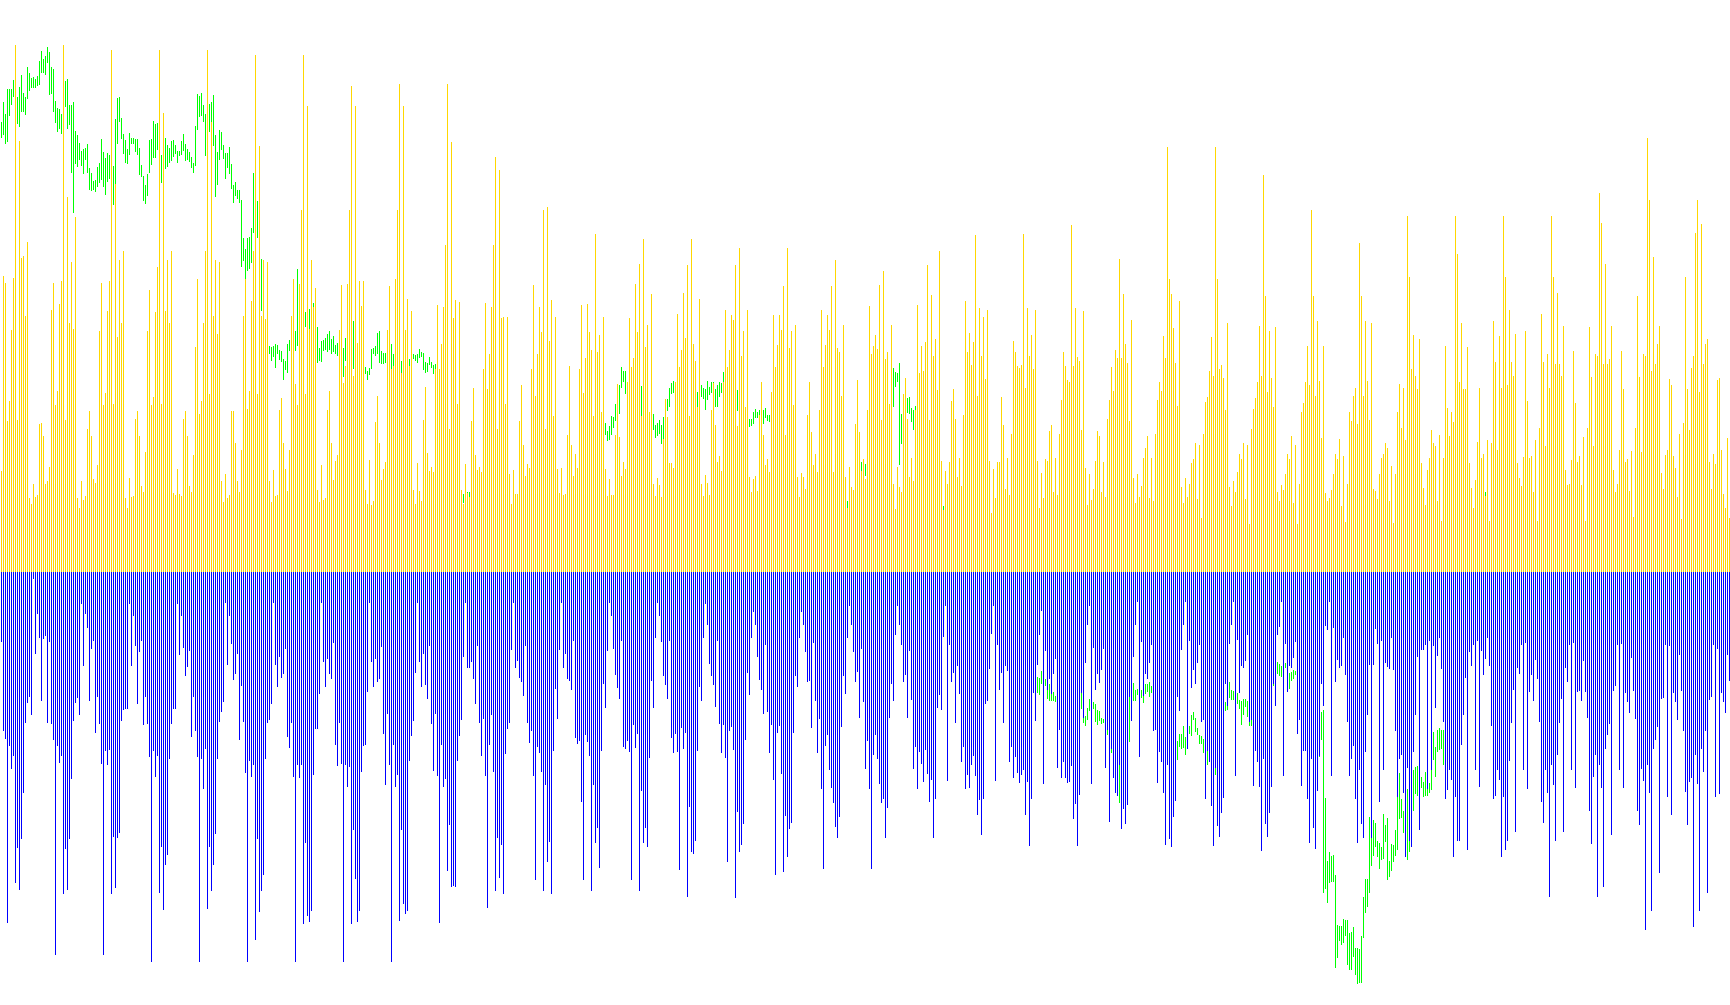
This tool is designed to measure and visualize the "aggressiveness" of a financial instrument by calculating the average price movement (in points) during specific periods. Instead of looking at simple price action, it provides a historical context of how much the market typically moves per candle over a set timeframe.
How the Logic Works
1. Data Collection Window The script looks back at a specific number of days (defined by the user, for example, 22 days) to establish a baseline for the market's behavior. It identifies how many candles occur within one day based on the current timeframe you are viewing (e.g., Minutes, Hours, or Daily charts).
2. Movement Analysis The core logic scans through these historical periods and separates the data into two categories:
- Upward Movements: It identifies candles where the price closed higher than it opened.
- Downward Movements: It identifies candles where the price closed lower than it opened.
3. Calculation of Averages For every period analyzed, the script calculates the total distance traveled by the price. It then divides these distances by the number of "Up" candles and "Down" candles respectively. This results in two specific values:
- The average size of an upward move.
- The average size of a downward move.
4. Visual Representation The results are displayed as a histogram in a separate window on your chart. It provides a clear visual representation of these averages, allowing you to see how much the instrument typically "pushes" in either direction.
Key Features for the User
- Timeframe Sensitivity: The script automatically adjusts its calculations depending on whether you are looking at 1-minute, 5-minute, 1-hour, or larger timeframes, ensuring the data remains relevant to your specific view.
- Future Shift: It includes a feature to shift the display forward by a specific number of candles, which can help in aligning the visual data with your current trading perspective.
- Simplified Comparison: By separating "Up" and "Down" movements into two distinct lines/histograms, it allows you to quickly see if the market tends to move more aggressively in one direction than the other over a long period.
//+---------------------------------------------------------------------+
//|                                             Aggressiveness2.mq4     |
//|                                         Copyright © Trofimov 2009   |
//+---------------------------------------------------------------------+
//| Àãðåññèâíîñòü2                                                      |
//|                                                                     |
//| Îïèñàíèå: Ïîêàçûâàåò ñêîëüêî ïóíêòîâ ïðîõîäèò èíñòðóìåíò            |
//| çà îäíó ñâå÷ó â ñðåäíåì çà ïîñëåäíèå nDays äíåé.                    |
//| Èíäèêàòîð ñëåäóåò çàïóñêàòü òîëüêî íà òàéìôðåéìàõ ìåëü÷å, ÷åì D!    |
//|                                                                     |
//| Àâòîðñêîå ïðàâî ïðèíàäëåæèò Òðîôèìîâó Åâãåíèþ Âèòàëüåâè÷ó, 2009     |
//+---------------------------------------------------------------------+


#property copyright "Copyright © Evgeniy Trofimov, 2009"
#property link      "http://TrofimovVBA.narod.ru/"

//---- Ñâîéñòâà èíäèêàòîðà
#property indicator_separate_window
#property indicator_buffers 2
#property indicator_color1 MidnightBlue
#property indicator_width1 1
#property indicator_color2 Maroon
#property indicator_width2 1

//---- Âõîäÿùèå ïàðàìåòðû
extern int nDays=22; // - êîëè÷åñòâî àíàëèçèðóåìûõ äíåé
extern int Future=3; // - íà ñêîëüêî ñâå÷åé âïåð¸ä ïîêàçûâàòü

double Buff_line1[];
double Buff_line2[];
double CUp, CDn;
int CandlesInDay;
//+------------------------------------------------------------------+
//|                Ôóíêöèÿ èíèöèàëèçàöèè èíäèêàòîðà                  |
//+------------------------------------------------------------------+
int init() {
   IndicatorBuffers(2);
   IndicatorDigits(0);
//---- ïàðàìåòðû ðèñîâàíèÿ (óñòàíîâêà íà÷àëüíîãî áàðà)
   //SetIndexDrawBegin(0,MyPeriod);
//---- x ðàñïðåäåëåííûõ áóôåðà èíäèêàòîðà
   SetIndexBuffer(0,Buff_line1);
   SetIndexBuffer(1,Buff_line2);
   SetIndexStyle(0, DRAW_HISTOGRAM, EMPTY, EMPTY);
   SetIndexStyle(1, DRAW_HISTOGRAM, EMPTY, EMPTY);
   SetIndexShift(0, Future);
   SetIndexShift(1, Future);
   SetIndexLabel(0, "Up");
   SetIndexLabel(1, "Dn");

//---- èìÿ èíäèêàòîðà è ïîäñêàçêè äëÿ ëèíèé
   IndicatorShortName("Aggressiveness2("+nDays+", "+Future+")");
   switch(Period()){
      case PERIOD_M1:  CandlesInDay=1440; break;
      case PERIOD_M5:  CandlesInDay=288;  break;
      case PERIOD_M15: CandlesInDay=96;   break;
      case PERIOD_M30: CandlesInDay=48;   break;
      case PERIOD_H1:  CandlesInDay=24;   break;
      case PERIOD_H4:  CandlesInDay=6;    break;
      default:         CandlesInDay=1;    break;
   }
   return(0);
}//init()
//+------------------------------------------------------------------+
//|                Ôóíêöèÿ èíäèêàòîðà                                |
//+------------------------------------------------------------------+
int start() {
   int BeginBar;
   int counted_bars=IndicatorCounted(); // Ðàíåå âû÷èñëåííûå áàðû
   if(counted_bars<0) return(-1); //---- îáõîäèì âîçìîæíûå îøèáêè
//---- íîâûå áàðû íå ïîÿâèëèñü è ïîýòîìó íè÷åãî ðèñîâàòü íå íóæíî
   BeginBar=Bars-counted_bars-1;
//---- îñíîâíûå ïåðåìåííûå
   double B;
   for(int t=BeginBar; t>=0; t--) {
      LengthCandle(t-Future);
      Buff_line1[t]=CUp;
      Buff_line2[t]=-CDn;
   }//Next t
   return(0);
} //start()
//+------------------------------------------------------------------+
int LengthCandle(int CurrenCandle) {
   int i, DayUp, DayDn;
   CUp=0; CDn=0;
   for(i=CurrenCandle+nDays*CandlesInDay;i>CurrenCandle;i=i-CandlesInDay) { // - íîìåð ñâå÷è
      if(Open[i]<Close[i]) {
         CUp=CUp+(Close[i]-Open[i])/Point;
         DayUp++;
      } else {
         CDn=CDn+(Open[i]-Close[i])/Point;
         DayDn++;
      }
   }//Next i
   //CDn=CDn/nDays;
   //CUp=CUp/nDays;
   if(DayUp!=0) CUp=CUp/DayUp;
   if(DayDn!=0) CDn=CDn/DayDn;
   return(0);
} //LengthCandle()
Comments