ADXDMI
Download script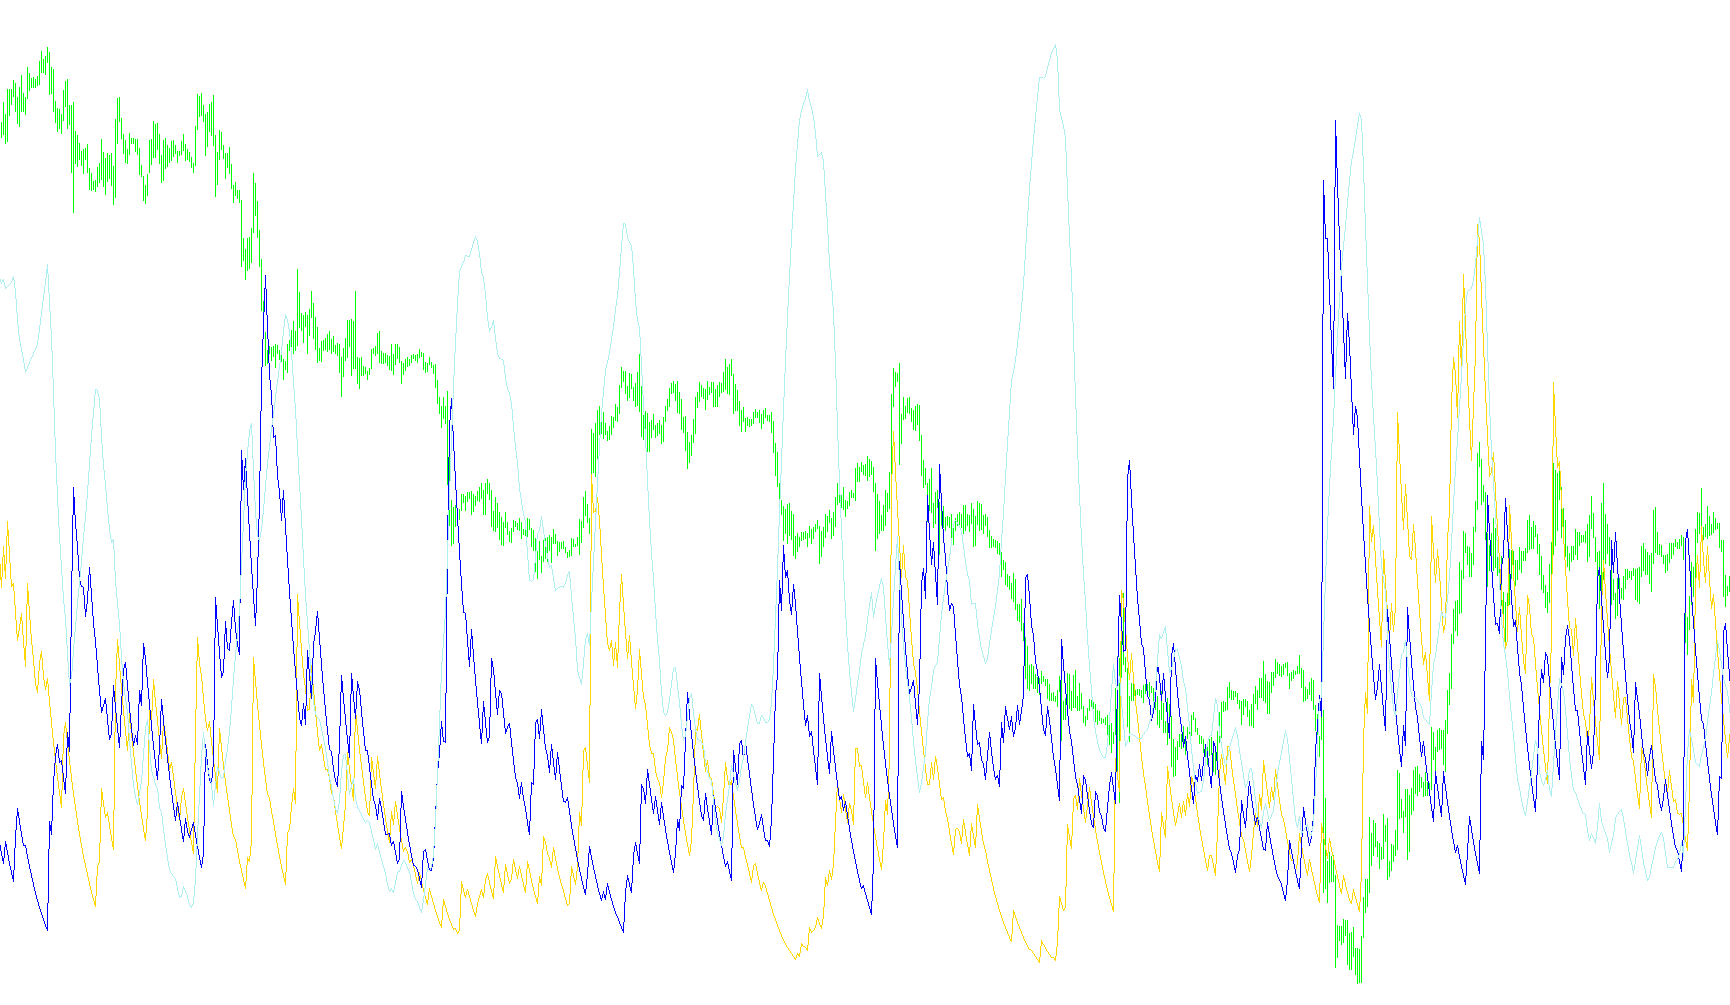
This script is a technical analysis tool designed to help traders identify the strength and direction of market trends. It works by calculating three distinct components based on price movement data, displaying them in a separate window below your main trading chart.
Core Functionality
The logic behind this indicator focuses on distinguishing between "upward" momentum, "downward" momentum, and the overall intensity of the market's movement. Here is how it processes that information:
1. Tracking Directional Movement (+DI and -DI) The script constantly monitors the high and low prices of consecutive candles.
- It measures the distance a price moves upward and compares it against the downward move to determine the "True Range" of the price action.
- It then isolates the positive movement (the +DI) and the negative movement (the -DI). These two values help you see which direction currently has the most "weight." If one line is significantly higher than the other, it suggests a prevailing trend in that specific direction.
2. Measuring Trend Strength (ADX) While the +DI and -DI lines tell you which way the market is moving, the ADX value tells you how strongly it is moving.
- The script calculates the difference between the upward and downward movements.
- It smooths this data out over a specific period to filter out minor "noise" or random price fluctuations.
- A rising ADX line typically indicates that a trend is gaining strength (regardless of whether it is going up or down), while a falling ADX suggests the market may be entering a sideways or range-bound phase.
3. Data Normalization To make these values easier to read on a standard chart, the script scales the results. It converts the raw directional calculations into a percentage-like format (scaled by 100), ensuring that all three components can be compared visually on the same scale.
Summary for the User
When viewing this indicator:
- The +DI line tracks bullish (upward) momentum.
- The -DI line tracks bearish (downward) momentum.
- The ADX line measures the overall vigor of the trend.
By observing these three lines together, you can determine not just where the price is going, but how much conviction the market currently has in that move.
//+------------------------------------------------------------------+
//|                                                         CADX.mq4 |
//|                      Copyright © 2005, FXTEAM                    |
//|               versiyon.1.1                                       |
//+------------------------------------------------------------------+
#property copyright "FXTEAM"
#property link      "FXTEAM Turkey"

#property indicator_separate_window
#property indicator_buffers 3

#property indicator_color1 YellowGreen
#property indicator_color2 Wheat
#property indicator_color3 White
//---- input parameters
extern int DMIPeriod=14;
extern int Smooth=10;
//---- buffers

double PlusSdiBuffer[];
double MinusSdiBuffer[];
double ADXs[];

//+------------------------------------------------------------------+
//| Custom indicator initialization function                         |
//+------------------------------------------------------------------+
int init()
  {

   IndicatorBuffers(3);
   SetIndexBuffer(0,PlusSdiBuffer);
   SetIndexBuffer(1,MinusSdiBuffer);
   SetIndexBuffer(2,ADXs);
   IndicatorShortName("FXDI("+DMIPeriod+")");

   SetIndexLabel(0,"+DI");
   SetIndexLabel(1,"-DI");
   SetIndexLabel(2,"ADX");

   SetIndexDrawBegin(0,DMIPeriod);
   SetIndexDrawBegin(1,DMIPeriod);
   SetIndexDrawBegin(2,DMIPeriod);

//----
   return(0);
  }
//+------------------------------------------------------------------+
//| Average Directional Movement Index                               |
//+------------------------------------------------------------------+
int start()
  {
   double pdm,mdm,tr,xx,yy,ss,mm;
   double price_high,price_low;
   double sabit,toplam,MA,PREP,PREN,PRETR;
   double PD;
   double ND,Buff;
   double ADX,PREADX;
   int    starti,i,j,n,counted_bars=IndicatorCounted();
//----
   if(Bars<=DMIPeriod) return(0);
//---- initial zero
      for(i=0;i<=Bars-2;i++)
      {
      PlusSdiBuffer[i]=0.0;
      MinusSdiBuffer[i]=0.0;
      ADXs[i]=0.0;
      }

   i=Bars;


//----
   PREP=0.0;
   PREN=0.0;
   PRETR=0.0;
   ADX=0.0;
   PREADX=0.0;
   i=Bars-2;


   while(i>=0)
     {

      if(High[i]>High[i+1] && (High[i]-High[i+1])>(Low[i+1]-Low[i]))
      {

      xx=High[i]-High[i+1];
      }
      else
      {
      xx=0.0;

      }

      PD=(((DMIPeriod-1.0)*PREP)+xx)/(DMIPeriod);

      if(Low[i]<Low[i+1] && (Low[i+1]-Low[i])>(High[i]-High[i+1]))
      {
      xx=Low[i+1]-Low[i];
      }
      else
      {
      xx=0.0;}

      ND=(((DMIPeriod-1.0)*PREN)+xx)/(DMIPeriod);

      //***
      Buff = MathAbs(PD-ND);
      if (Buff == 0) {
         ADX=(((Smooth-1.0)*PREADX))/Smooth;
      }
      else{
      ADX=(((Smooth-1.0)*PREADX)+  (MathAbs(PD-ND)/(PD+ND)))/Smooth;}

      //**
      PREN=ND;
      PREP=PD;
      PREADX=ADX;

      double num1=MathAbs(price_high-price_low);
      double num2=MathAbs(price_high-Close[i+1]);
      double num3=MathAbs(Close[i+1]-price_low);

      tr=MathMax(num1,num2);
      tr=MathMax(tr,num3);


      tr=(((DMIPeriod-1.0)*PRETR)+tr)/DMIPeriod;
      PRETR=tr;
      PlusSdiBuffer[i]=100000*(PD/tr);
      MinusSdiBuffer[i]=100000*(ND/tr);
      ADXs[i]=100*ADX;

      i--;
     }


      return(0);
  }
//+------------------------------------------------------------------+
Comments