+ADR (1_5_10_20_60)
Download script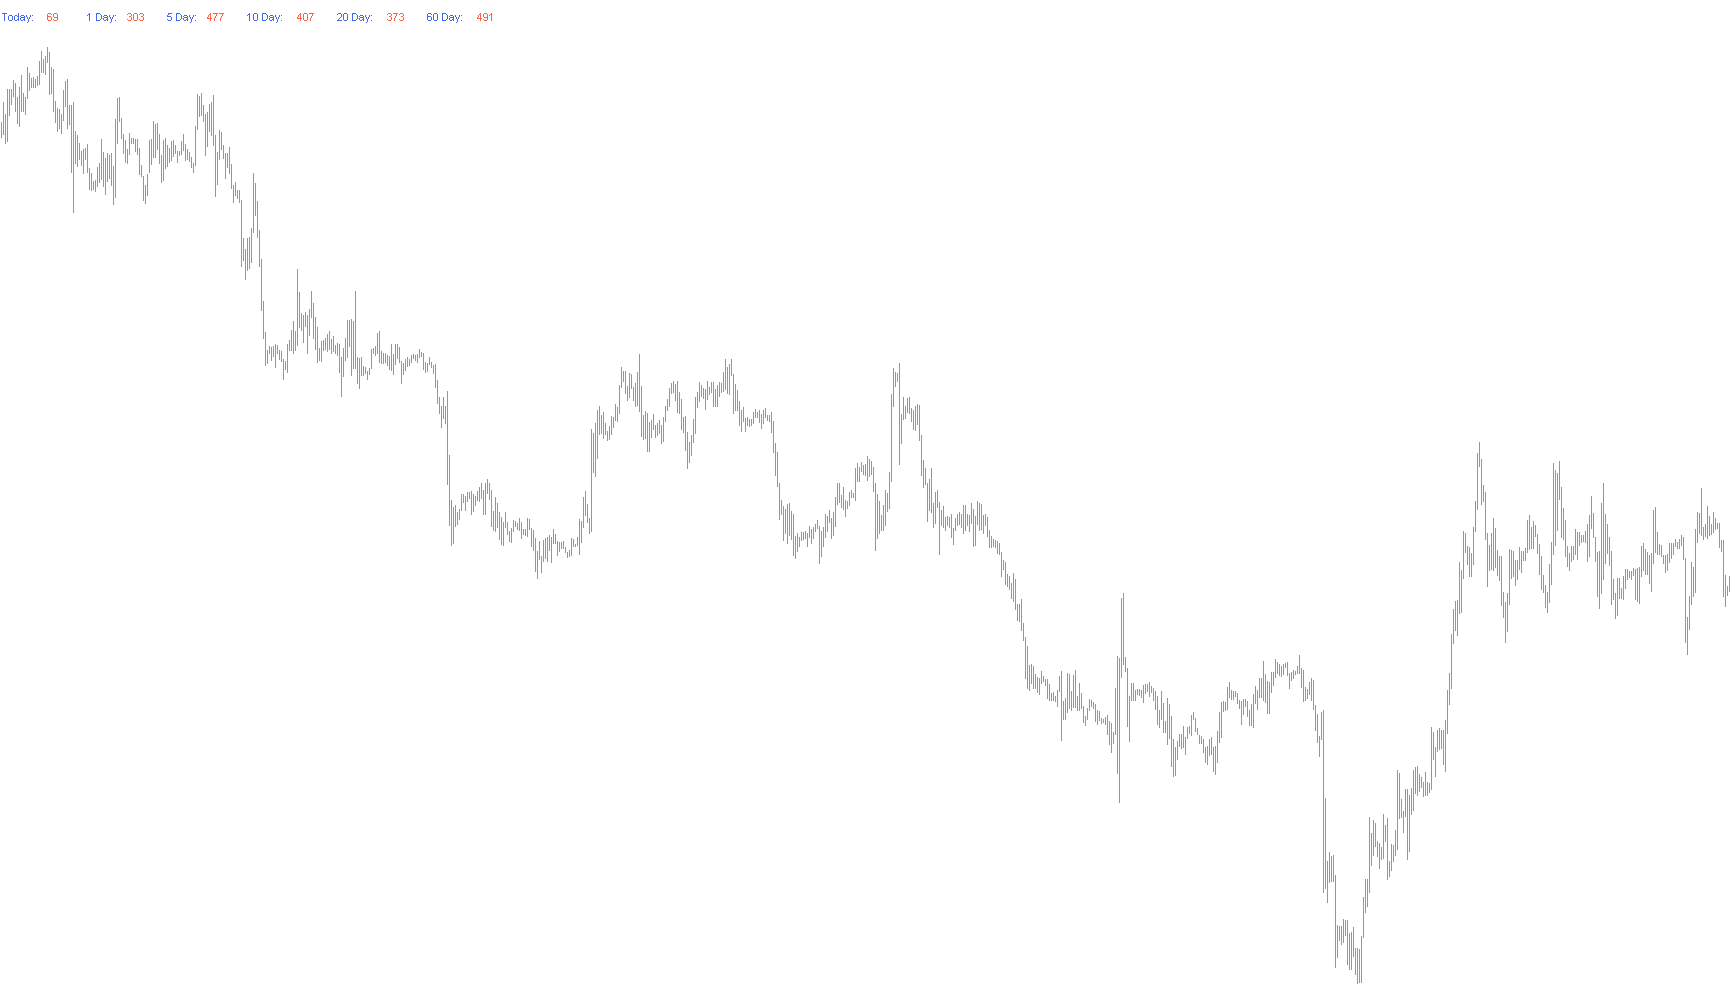
This tool is designed to provide traders with a clear, real-time visual dashboard of market volatility and price movement. By analyzing historical data, it calculates how much a specific currency pair typically moves in a single day, allowing you to make more informed decisions based on "normal" market behavior rather than guesswork.
Core Functionality
The script monitors the market and performs the following calculations automatically:
- Historical Range Tracking: The tool looks back at the price action over various timeframes to calculate the Average Daily Range (ADR). It specifically tracks:
- The current day's movement.
- Yesterday's total movement.
- Rolling averages for 1, 5, 10, 20, and 60 days.
- Volatility Averaging: It calculates a composite average by blending several different timeframes (1, 5, 10, 20, and 60 days). This helps smooth out "noise" and gives you a more reliable picture of the asset's typical daily volatility.
- Dynamic Space Analysis: The logic determines how much "room" is left in the day’s price movement. By comparing the current market price against the daily high and low, it estimates how much further the price can realistically travel before reaching its expected limit.
Risk Management Features
Beyond just showing you the numbers, this script assists with trade execution by providing specific data for risk management:
- Stop-Loss Calculations: Based on a customizable Risk-to-Reward ratio, the tool calculates potential Stop Loss distances. It uses different percentages (such as 50% or 75%) of the calculated daily ranges to suggest where a safer exit point might be located.
- Automated Visual Dashboard: Instead of requiring you to run complex math, the script draws a professional text dashboard directly on your trading chart. This provides an at-a-glance summary of all the key metrics mentioned above, organized clearly by timeframe.
How It Benefits Your Trading
By using this logic, you move away from subjective trading. Instead of wondering if a price move is "too big," you can see exactly how it compares to the 5-day or 20-day average. It allows for more disciplined entries and exits by providing mathematical boundaries for your trades based on the market's own historical behavior.
//+------------------------------------------------------------------+
//|                                                ADR_SL-NoLine.mq4 |
//|                                       Copyright © Terry Nicholls |
//| Some code modified from TSR_Ranges.mq4 by Ogeima                 |
//| made for FXiGoR for the TSR Trend Slope Retracement method       |
//| modified to the DYNAMIC Daily Range Breakout System              |
//+------------------------------------------------------------------+

/* This will display at the top of your chart the Average Daily Range (pip movement)
   for Yesterday, Today, and 5, 10, and 20 day periods.
   Below that will display the number of pips for a Stop Loss based on 1/2 and 3/4
   of the ADR. */

#property copyright "Copyright © Terry Nicholls"

#property indicator_chart_window

extern double  Risk_to_Reward_ratio =  3.0;

int nDigits;
double today_high=0;
double today_low=0;
double D=0;
double nD=0;
double nhR1=0;
double nqR1=0;
double nhR5=0;
double nqR5=0;
double nhR10=0;
double nqR10=0;
double nhR20=0;
double nqR20=0;
double nhR60=0;
double nqR60=0;
double rates_d1[2][6];

//+------------------------------------------------------------------+
//| Custom indicator initialization function                         |
//+------------------------------------------------------------------+

int init()
  {
   IndicatorShortName("Avg_Dly_Rng");
   return(0);
  }

//+------------------------------------------------------------------+
//| Custor indicator deinitialization function                       |
//+------------------------------------------------------------------+

int deinit()
  {
   ObjectDelete("Avg_Dly_Rng1");
   ObjectDelete("Avg_Dly_Rng2");
   ObjectDelete("Avg_Dly_Rng3");
   ObjectDelete("Avg_Dly_Rng4");
   ObjectDelete("Avg_Dly_Rng5");
   ObjectDelete("Avg_Dly_Rng6");
   ObjectDelete("Avg_Dly_Rng7");
   ObjectDelete("Avg_Dly_Rng8");
   ObjectDelete("Avg_Dly_Rng9");
   ObjectDelete("Avg_Dly_Rng10");
   ObjectDelete("Avg_Dly_Rng11");
   ObjectDelete("Avg_Dly_Rng12");
   ObjectDelete("Avg_Dly_Rng13");
   ObjectDelete("Avg_Dly_Rng14");
   ObjectDelete("Avg_Dly_Rng15");
   ObjectDelete("Avg_Dly_Rng16");
   ObjectDelete("Avg_Dly_Rng17");
   ObjectDelete("Avg_Dly_Rng18");
   ObjectDelete("Avg_Dly_Rng19");
   ObjectDelete("Avg_Dly_Rng20");
   ObjectDelete("Avg_Dly_Rng21");
   ObjectDelete("Avg_Dly_Rng22");
   ObjectDelete("Avg_Dly_Rng23");
   ObjectDelete("Avg_Dly_Rng24");
   ObjectDelete("Avg_Dly_Rng25");
   ObjectDelete("Avg_Dly_Rng26");
   ObjectDelete("Avg_Dly_Rng27");
   return(0);
  }

//+------------------------------------------------------------------+
//| Custom indicator iteration function                              |
//+------------------------------------------------------------------+

int start()
  {
ArrayCopyRates(rates_d1, Symbol(), PERIOD_D1);   //---- Get new daily prices

   int R1=0,R5=0,R10=0,R20=0,R60=0,RAvg=0;
   int RoomUp=0,RoomDown=0,StopLoss_Long=0,StopLoss_Short=0;
   double   SL_Long=0,SL_Short=0;
   double   low0=0,high0=0;
   string   Text="";
   int i=0;

today_high = rates_d1[0][3];
today_low = rates_d1[0][2];

D = (today_high - today_low);

   R1 =  (iHigh(NULL,PERIOD_D1,1)-iLow(NULL,PERIOD_D1,1))/Point;
   for(i=1;i<=5;i++)
      R5    =    R5  +  (iHigh(NULL,PERIOD_D1,i)-iLow(NULL,PERIOD_D1,i))/Point;
   for(i=1;i<=10;i++)
      R10   =    R10 +  (iHigh(NULL,PERIOD_D1,i)-iLow(NULL,PERIOD_D1,i))/Point;
   for(i=1;i<=20;i++)
      R20   =    R20 +  (iHigh(NULL,PERIOD_D1,i)-iLow(NULL,PERIOD_D1,i))/Point;
   for(i=1;i<=60;i++)
      R60   =    R60 +  (iHigh(NULL,PERIOD_D1,i)-iLow(NULL,PERIOD_D1,i))/Point;

   R5 = R5/5;
   R10 = R10/10;
   R20 = R20/20;
   R60 = R60/60;
   RAvg  =  (R1+R5+R10+R20+R60)/5;

   low0  =  iLow(NULL,PERIOD_D1,0);
   high0 =  iHigh(NULL,PERIOD_D1,0);
   RoomUp   =  RAvg - (Bid - low0)/Point;
   RoomDown =  RAvg - (high0 - Bid)/Point;
   StopLoss_Long  =  RoomUp/Risk_to_Reward_ratio;
   SL_Long        =  Bid - nhR1*Point;
   StopLoss_Short =  RoomDown/Risk_to_Reward_ratio;
   SL_Short       =  Bid + nhR1*Point;

if (D > 1)
{
	nD = D;
}
else
{
	nD = D*10000;
}

if (R1 > 1)
{
	nhR1 = R1/2;
}
else
{
	nhR1 = 0;
}

if (R1 > 1)
{
	nqR1 = R1*0.75;
}
else
{
	nqR1 = 0;
}

if (R5 > 1)
{
	nhR5 = R5/2;
}
else
{
	nhR5 = 0;
}

if (R5 > 1)
{
	nqR5 = R5*0.75;
}
else
{
	nqR5 = 0;
}

if (R10 > 1)
{
	nhR10 = R10/2;
}
else
{
	nhR10 = 0;
}

if (R10 > 1)
{
	nqR10 = R10*0.75;
}
else
{
	nqR20 = 0;
}

if (R20 > 1)
{
	nhR20 = R20/2;
}
else
{
	nhR20 = 0;
}

if (R20 > 1)
{
	nqR20 = R20*0.75;
}
else
{
	nqR20 = 0;
}

// Displays Average Daily Range for Today, Yesterday, 5 Days, 10 Days, and 20 Days

        ObjectCreate("Avg_Dly_Rng1", OBJ_LABEL, 0, 0, 0);
        ObjectSetText("Avg_Dly_Rng1","Today: ", 8, "Arial", RoyalBlue);
        ObjectSet("Avg_Dly_Rng1", OBJPROP_CORNER, 0);
        ObjectSet("Avg_Dly_Rng1", OBJPROP_XDISTANCE, 5);
        ObjectSet("Avg_Dly_Rng1", OBJPROP_YDISTANCE, 12);

        ObjectCreate("Avg_Dly_Rng2", OBJ_LABEL, 0, 0, 0);
        ObjectSetText("Avg_Dly_Rng2",DoubleToStr(nD ,0),8, "Arial", Tomato);
        ObjectSet("Avg_Dly_Rng2", OBJPROP_CORNER, 0);
        ObjectSet("Avg_Dly_Rng2", OBJPROP_XDISTANCE, 50);
        ObjectSet("Avg_Dly_Rng2", OBJPROP_YDISTANCE, 12);

        ObjectCreate("Avg_Dly_Rng3", OBJ_LABEL, 0, 0, 0);
        ObjectSetText("Avg_Dly_Rng3","1 Day: ", 8, "Arial", RoyalBlue);
        ObjectSet("Avg_Dly_Rng3", OBJPROP_CORNER, 0);
        ObjectSet("Avg_Dly_Rng3", OBJPROP_XDISTANCE, 90);
        ObjectSet("Avg_Dly_Rng3", OBJPROP_YDISTANCE, 12);

        ObjectCreate("Avg_Dly_Rng4", OBJ_LABEL, 0, 0, 0);
        ObjectSetText("Avg_Dly_Rng4",DoubleToStr(R1 ,0),8, "Arial", Tomato);
        ObjectSet("Avg_Dly_Rng4", OBJPROP_CORNER, 0);
        ObjectSet("Avg_Dly_Rng4", OBJPROP_XDISTANCE, 130);
        ObjectSet("Avg_Dly_Rng4", OBJPROP_YDISTANCE, 12);

        ObjectCreate("Avg_Dly_Rng5", OBJ_LABEL, 0, 0, 0);
        ObjectSetText("Avg_Dly_Rng5","5 Day: ", 8, "Arial", RoyalBlue);
        ObjectSet("Avg_Dly_Rng5", OBJPROP_CORNER, 0);
        ObjectSet("Avg_Dly_Rng5", OBJPROP_XDISTANCE, 170);
        ObjectSet("Avg_Dly_Rng5", OBJPROP_YDISTANCE, 12);

        ObjectCreate("Avg_Dly_Rng6", OBJ_LABEL, 0, 0, 0);
        ObjectSetText("Avg_Dly_Rng6",DoubleToStr(R5 ,0),8, "Arial", Tomato);
        ObjectSet("Avg_Dly_Rng6", OBJPROP_CORNER, 0);
        ObjectSet("Avg_Dly_Rng6", OBJPROP_XDISTANCE, 210);
        ObjectSet("Avg_Dly_Rng6", OBJPROP_YDISTANCE, 12);

        ObjectCreate("Avg_Dly_Rng7", OBJ_LABEL, 0, 0, 0);
        ObjectSetText("Avg_Dly_Rng7","10 Day: ",8, "Arial", RoyalBlue);
        ObjectSet("Avg_Dly_Rng7", OBJPROP_CORNER, 0);
        ObjectSet("Avg_Dly_Rng7", OBJPROP_XDISTANCE, 250);
        ObjectSet("Avg_Dly_Rng7", OBJPROP_YDISTANCE, 12);

        ObjectCreate("Avg_Dly_Rng8", OBJ_LABEL, 0, 0, 0);
        ObjectSetText("Avg_Dly_Rng8",DoubleToStr(R10 ,0),8, "Arial", Tomato);
        ObjectSet("Avg_Dly_Rng8", OBJPROP_CORNER, 0);
        ObjectSet("Avg_Dly_Rng8", OBJPROP_XDISTANCE, 300);
        ObjectSet("Avg_Dly_Rng8", OBJPROP_YDISTANCE, 12);

        ObjectCreate("Avg_Dly_Rng9", OBJ_LABEL, 0, 0, 0);
        ObjectSetText("Avg_Dly_Rng9","20 Day: ",8, "Arial", RoyalBlue);
        ObjectSet("Avg_Dly_Rng9", OBJPROP_CORNER, 0);
        ObjectSet("Avg_Dly_Rng9", OBJPROP_XDISTANCE, 340);
        ObjectSet("Avg_Dly_Rng9", OBJPROP_YDISTANCE, 12);

        ObjectCreate("Avg_Dly_Rng10", OBJ_LABEL, 0, 0, 0);
        ObjectSetText("Avg_Dly_Rng10",DoubleToStr(R20 ,0),8, "Arial", Tomato);
        ObjectSet("Avg_Dly_Rng10", OBJPROP_CORNER, 0);
        ObjectSet("Avg_Dly_Rng10", OBJPROP_XDISTANCE, 390);
        ObjectSet("Avg_Dly_Rng10", OBJPROP_YDISTANCE, 12);

        ObjectCreate("Avg_Dly_Rng11", OBJ_LABEL, 0, 0, 0);
        ObjectSetText("Avg_Dly_Rng11","60 Day: ",8, "Arial", RoyalBlue);
        ObjectSet("Avg_Dly_Rng11", OBJPROP_CORNER, 0);
        ObjectSet("Avg_Dly_Rng11", OBJPROP_XDISTANCE, 430);
        ObjectSet("Avg_Dly_Rng11", OBJPROP_YDISTANCE, 12);

        ObjectCreate("Avg_Dly_Rng12", OBJ_LABEL, 0, 0, 0);
        ObjectSetText("Avg_Dly_Rng12",DoubleToStr(R60 ,0),8, "Arial", Tomato);
        ObjectSet("Avg_Dly_Rng12", OBJPROP_CORNER, 0);
        ObjectSet("Avg_Dly_Rng12", OBJPROP_XDISTANCE, 480);
        ObjectSet("Avg_Dly_Rng12", OBJPROP_YDISTANCE, 12);


   return(0);
  }

//+------------------------------------------------------------------+
Comments