2pbIdeal1MA
Download script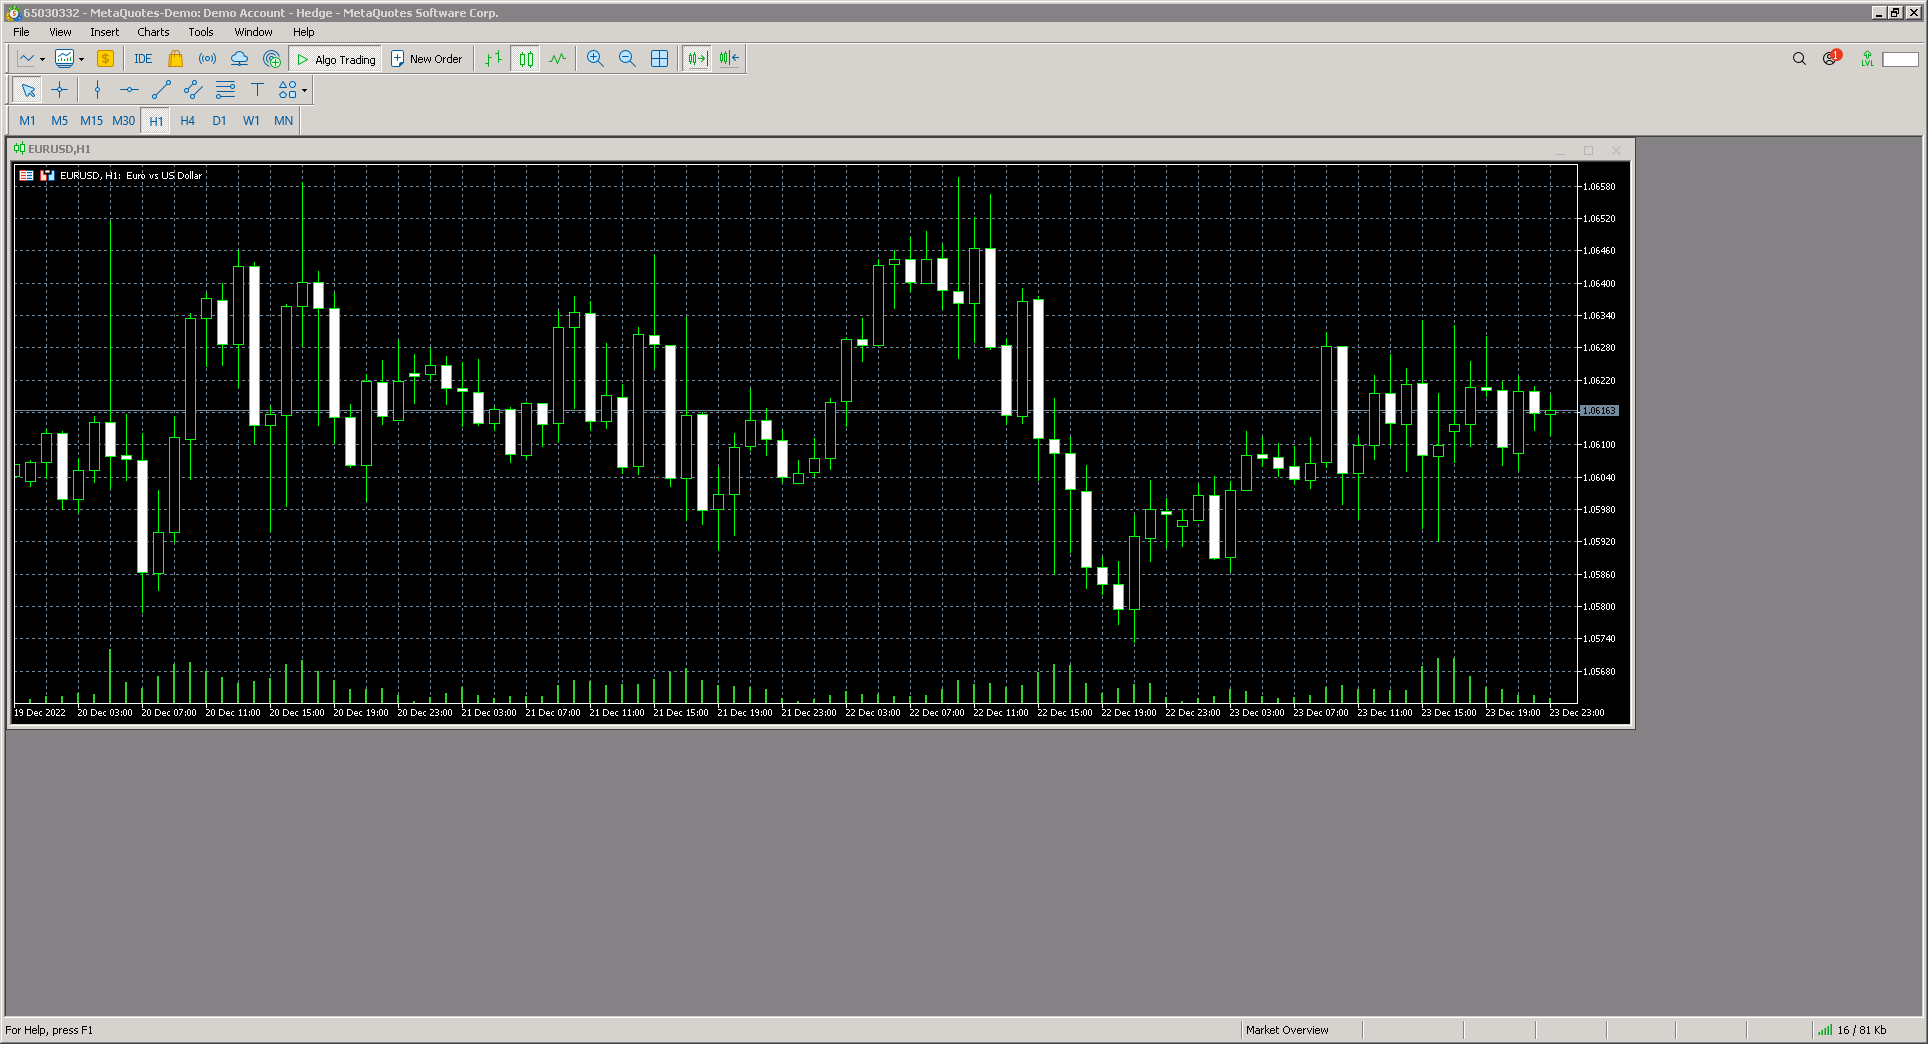
This tool is a technical analysis indicator designed for the MetaTrader 5 trading platform. Its primary purpose is to provide a smoothed representation of price action, helping traders filter out "market noise" to more clearly see the underlying trend of an asset.
Core Logic and Functionality
The script functions by calculating a sophisticated moving average. Unlike standard moving averages that might simply take a linear average of past prices (which can often be laggy or reactive), this indicator utilizes a specialized mathematical formula designed for "Ideal" smoothing.
Key components of its logic include:
- Dual Smoothing Parameters: The indicator relies on two distinct periods (Period1 and Period2). These act as weights that determine how much influence historical data has on the current line. By adjusting these, users can control the balance between responsiveness (how quickly the line moves) and smoothness (how steady the line appears).
- Dynamic Weighting: The logic calculates a "difference" between consecutive price points. It then uses this difference to adjust the weighting of the average dynamically. This allows the indicator to adapt more fluidly to changes in market momentum compared to basic moving averages.
- Iterative Calculation: The script processes the price data sequentially. To determine the current value of the line, it looks at the current price, the previous price, and the previously calculated value of the moving average itself. This creates a continuous, connected curve that reflects the flow of the market over time.
- Visual Customization: The indicator is programmed to appear as a solid blue line on the main chart. It also includes a "Horizontal Shift" feature, which allows traders to physically move the entire line forward or backward on the chart to better align with their specific analysis needs.
How it behaves on a chart
When you apply this script, it generates a smooth curve that follows the price of the asset. Because of its unique smoothing logic, it aims to provide a clearer picture of the "ideal" path of the price, helping traders identify support/resistance levels and trend directions with less visual distraction from minor, erratic price fluctuations.
//+------------------------------------------------------------------+
//|                                                  2pbIdeal1MA.mq5 |
//|                             Copyright © 2011,   Nikolay Kositsin |
//|                              Khabarovsk,   farria@mail.redcom.ru |
//+------------------------------------------------------------------+
//---- author of the indicator
#property copyright "Copyright © 2011, Nikolay Kositsin"
//---- link to the website of the author
#property link "farria@mail.redcom.ru"
//---- indicator version
#property version   "1.00"
//---- drawing the indicator in the main window
#property indicator_chart_window
//---- one buffer is used for calculation and drawing of the indicator
#property indicator_buffers 1
//---- only one plot is used
#property indicator_plots   1
//---- drawing the indicator as a line
#property indicator_type1   DRAW_LINE
//---- blue color is used as the color of the indicator line
#property indicator_color1  Blue
//---- the indicator line is a continuous curve
#property indicator_style1  STYLE_SOLID
//---- indicator line width is equal to 2
#property indicator_width1  2
//---- displaying the indicator label
#property indicator_label1  "2pbIdealMA"

//---- indicator input parameters
input int Period1 = 10; // Rough smoothing
input int Period2 = 10; // Adjusting smoothing
input int MAShift=0;    // Horizontal shift of the average in bars

//---- declaration of a dynamic array that
//---- will be used as an indicator buffer
double ExtLineBuffer[];
//---- declarations of variables for smoothing constants
double w1,w2;
//+------------------------------------------------------------------+
//|  Smoothing from Neutron                                          |
//+------------------------------------------------------------------+
double GetIdealMASmooth(double W1_,     // first smoothing constant
                        double W2_,     // second smoothing constant
                        double Series1, // the value of the time series from the current bar
                        double Series0, // the value of the time series from the previous bar
                        double Resalt1  // the value of the average from the previous bar
                        )
  {
//----
   double Resalt0,dSeries,dSeries2;
   dSeries=Series0-Series1;
   dSeries2=dSeries*dSeries-1.0;

   Resalt0=(W1_ *(Series0-Resalt1)+
            Resalt1+W2_*Resalt1*dSeries2)
   /(1.0+W2_*dSeries2);
//----
   return(Resalt0);
  }
//+------------------------------------------------------------------+
//| Custom indicator initialization function                         |
//+------------------------------------------------------------------+
void OnInit()
  {
//---- initializations of variables
   w1=1.0/Period1;
   w2=1.0/Period2;
//---- set ExtLineBuffer dynamic array as indicator buffer
   SetIndexBuffer(0,ExtLineBuffer,INDICATOR_DATA);
//---- horizontal shift of the indicator by MAShift
   PlotIndexSetInteger(0,PLOT_SHIFT,MAShift);
//---- set the position, from which the indicator drawing starts
   PlotIndexSetInteger(0,PLOT_DRAW_BEGIN,1);
//---- initializations of variable for indicator short name
   string shortname;
   StringConcatenate(shortname,"2pbIdealMA(",w1,",",w2,")");
//---- create label to display in Data Window
   PlotIndexSetString(0,PLOT_LABEL,shortname);
//---- creating a name for displaying in a separate sub-window and in a tooltip
   IndicatorSetString(INDICATOR_SHORTNAME,shortname);
//---- determination of accuracy of displaying of the indicator values
   IndicatorSetInteger(INDICATOR_DIGITS,_Digits+1);
//---- restriction to draw empty values for the indicator
   PlotIndexSetDouble(0,PLOT_EMPTY_VALUE,0.0);
//----
  }
//+------------------------------------------------------------------+
//| Custom indicator iteration function                              |
//+------------------------------------------------------------------+
int OnCalculate(const int rates_total,     // number of bars in history at the current tick
                const int prev_calculated, // number of bars calculated at previous call
                const int begin,           // bars reliable counting beginning index
                const double &price[]      // price array for calculation of the indicator
                )
  {
//---- checking the number of bars to be enough for the calculation
   if(rates_total<1+begin) return(0);

//---- declarations of local variables
   int first,bar;

//---- calculation of the 'first' starting index for the bars recalculation loop
   if(prev_calculated>rates_total || prev_calculated<=0) // checking for the first start of the indicator calculation
     {
      first=1+begin;  // starting index for calculation of all bars
      //---- increase the position of the beginning of data by 'begin' bars as a result of calculation using data of another indicator
      if(begin>0)
         PlotIndexSetInteger(0,PLOT_DRAW_BEGIN,begin+1);

      ExtLineBuffer[begin]=price[begin];
     }
   else first=prev_calculated-1; // starting index for calculation of new bars

//---- main indicator calculation loop
   for(bar=first; bar<rates_total; bar++)
      ExtLineBuffer[bar]=GetIdealMASmooth(w1,w2,price[bar-1],price[bar],ExtLineBuffer[bar-1]);
//----
   return(rates_total);
  }
//+------------------------------------------------------------------+
Comments