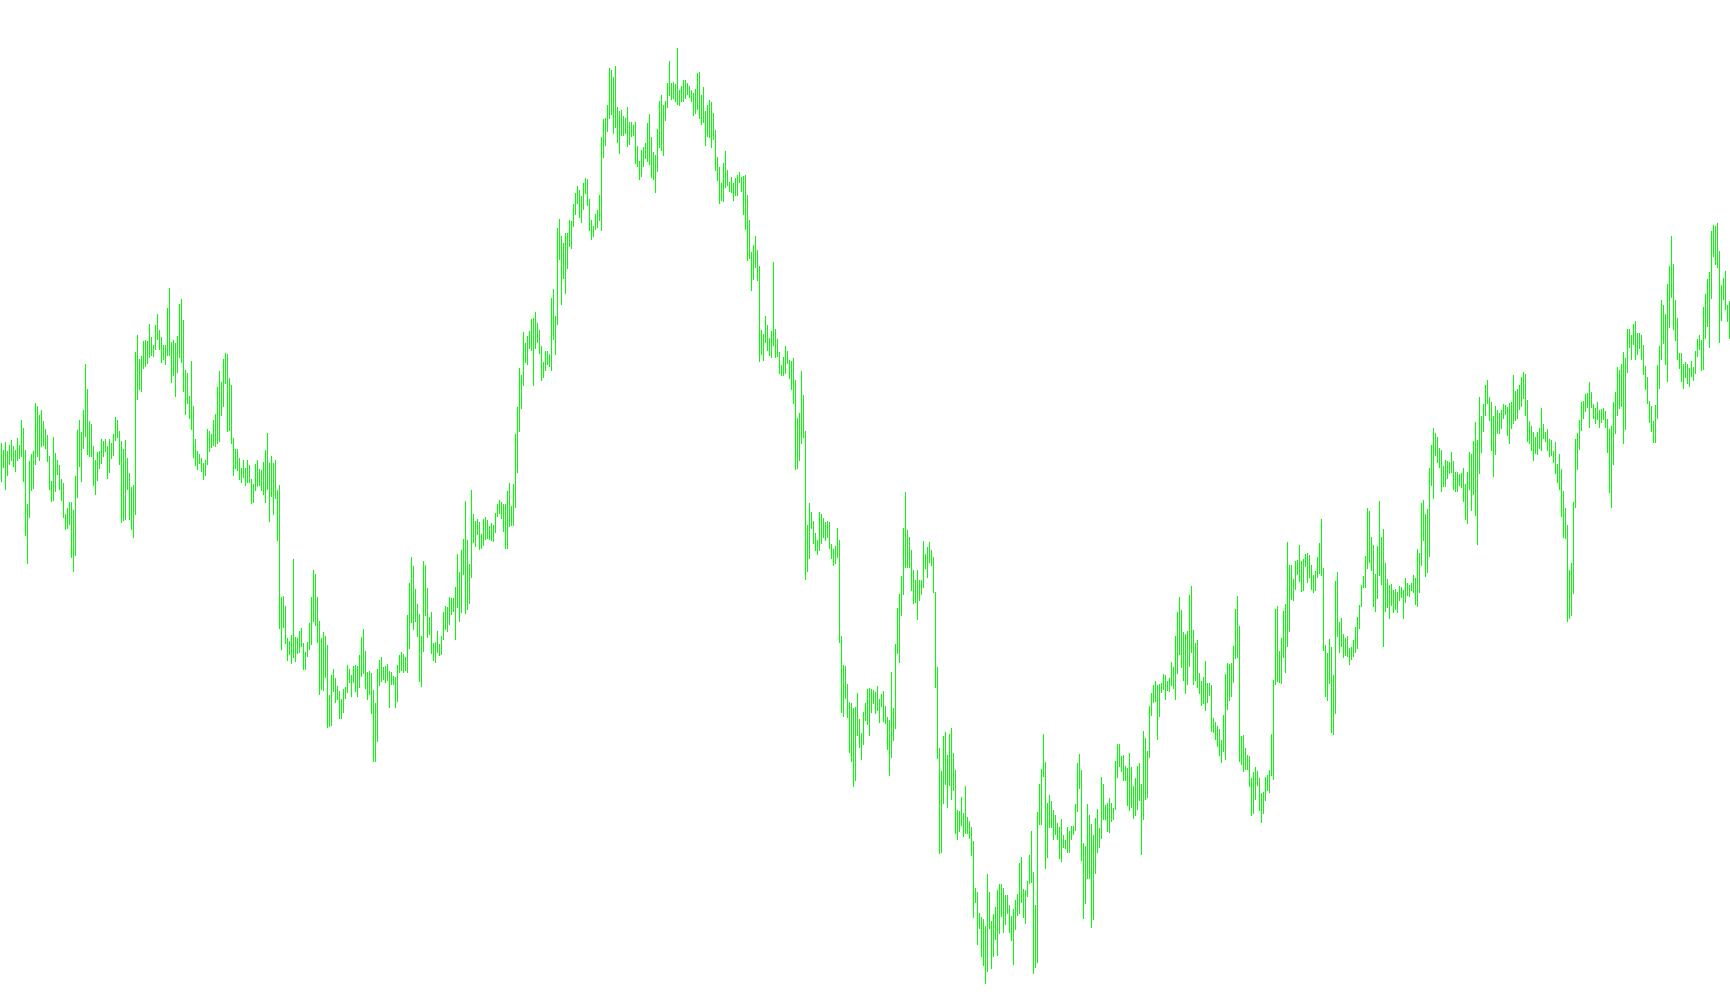
This tool is designed to provide traders with a visual framework for understanding market structure by identifying key price boundaries. It functions by analyzing price action across different time horizons and projecting that information onto your current trading screen, allowing you to see the "bigger picture" without losing sight of immediate price movements.
How the Logic Works
Multi-Timeframe Integration The core strength of this script is its ability to bridge different timeframes. Instead of only showing you what is happening on the chart you are currently looking at (for example, a 15-minute chart), it can pull data from higher periods (like the 4-hour or Daily charts). This helps traders identify major trends and significant support or resistance levels that might be invisible on shorter timeframes.
Fractal Channel Identification The logic relies on "Fractals"—specific geometric patterns in price action that identify local highs and lows. By using these fractals, the tool identifies three distinct price components:
- Upper Channel: Marks the ceiling of a trend or a significant area of resistance.
- Lower Channel: Marks the floor of a trend or a significant area of support.
- Middle Channel: Provides a central reference point or equilibrium between the highs and lows.
Data Processing & Visualization The script automatically scans historical price data to find these fractal points based on your specific settings (such as the type of channel and its margins). Once it identifies these points on the higher timeframe, it "maps" them onto your current chart. This creates a visual guide consisting of three lines that move with the market, helping you stay aligned with the dominant trend while identifying potential areas where the price might react or reverse.
Key Benefits for Trading
By using this logic, a trader can more easily distinguish between minor price "noise" and significant structural changes. It provides a clear visual boundary for where the market is currently heading, making it easier to decide when to enter a trade in the direction of the trend or stay out when the price reaches a significant channel boundary.
/*-----------------------------+
|			       |
| Shared by www.Aptrafx.com    |
|			       |
+------------------------------*/

//+------------------------------------------------------------------+
//|                                        MTF_FractalChannel_v1.mq4 |
//|                                Copyright © 2006, TrendLaboratory |
//|            http://finance.groups.yahoo.com/group/TrendLaboratory |
//|                                   E-mail: igorad2003@yahoo.co.uk |
//+------------------------------------------------------------------+
#property copyright "Copyright © 2006, TrendLaboratory"
#property link      "http://finance.groups.yahoo.com/group/TrendLaboratory"

#property indicator_chart_window
#property indicator_buffers 3
#property indicator_color1 LightBlue
#property indicator_color2 Tomato
#property indicator_color3 Yellow
#property indicator_width1 2
#property indicator_width2 2
//---- input parameters
extern int     TimeFrame   = 0;
extern int     ChannelType = 1;
extern double  Margins     = 0;
extern int     Shift       = 0;
extern int     Mode        = 0;

//---- buffers
double UpBuffer[];
double DnBuffer[];
double MdBuffer[];

//+------------------------------------------------------------------+
//| Custom indicator initialization function                         |
//+------------------------------------------------------------------+
int init()
  {
   string short_name;
//---- indicator line
   SetIndexStyle(0,DRAW_LINE);
   SetIndexStyle(1,DRAW_LINE);
   SetIndexStyle(2,DRAW_LINE,2);
   SetIndexBuffer(0,UpBuffer);
   SetIndexBuffer(1,DnBuffer);
   SetIndexBuffer(2,MdBuffer);
//---- name for DataWindow and indicator subwindow label
   short_name="MTF FractalChannel("+ChannelType+")";
   IndicatorShortName(short_name);
   SetIndexLabel(0,"Up Channel");
   SetIndexLabel(1,"Down Channel");
   SetIndexLabel(2,"Middle Channel");

   SetIndexShift(0,Shift);
   SetIndexShift(1,Shift);
   SetIndexShift(2,Shift);
//----
   SetIndexDrawBegin(0,2*ChannelType);
   SetIndexDrawBegin(1,2*ChannelType);
   SetIndexDrawBegin(2,2*ChannelType);
//----
   return(0);
  }
//+------------------------------------------------------------------+
//| FractalChannel_v3.1                                                |
//+------------------------------------------------------------------+
int start()
{
   datetime TimeArray[];
   int      i,limit,y=0,counted_bars=IndicatorCounted();

// Plot defined time frame on to current time frame
   ArrayCopySeries(TimeArray,MODE_TIME,Symbol(),TimeFrame);

   limit=Bars-counted_bars+TimeFrame/Period();
   for(i=0,y=0;i<limit;i++)
   {
   if (Time[i]<TimeArray[y]) y++;

	UpBuffer[i] = iCustom(NULL,TimeFrame,"FractalChannel_v4",ChannelType,Margins,Shift,Mode,0,y);
   DnBuffer[i] = iCustom(NULL,TimeFrame,"FractalChannel_v4",ChannelType,Margins,Shift,Mode,1,y);
   MdBuffer[i] = iCustom(NULL,TimeFrame,"FractalChannel_v4",ChannelType,Margins,Shift,Mode,2,y);
	}
return(0);
}
Comments