Here's a breakdown of what this MetaTrader script does, explained in plain language for someone who isn't a programmer:
Overall Goal:
This script attempts to predict future price movements by looking for similar patterns in past price data. It's like saying, "If the market behaved like this in the past, it's likely to behave like that now."
How It Works:
-
RSI Calculation (Real): The script first calculates a modified Relative Strength Index (RSI) value. RSI is a common indicator used to measure the magnitude of recent price changes to evaluate overbought or oversold conditions in the price of a stock or other asset. In essence, the script calculates a custom version of RSI using the ratio of average price increases over a certain period (
period) to the total price movement (increases and decreases). -
Pattern Recognition (Storage in
dat): The script stores recent RSI values (Real) into a historical database calleddat. It saves these past RSI patterns so it can later compare them to the current pattern. Thepr_periodinput determines how many past RSI values are stored to form a pattern. It?s like creating a library of RSI "fingerprints". Each row in thedatarray represents an RSI pattern from the past, and the last column (99) stores the RSI value following that pattern to remember what happened after the pattern emerged. -
Similarity Search: For each new RSI value calculated, the script searches through its historical RSI fingerprint library (
dat) for patterns that are similar to the current pattern. Theerrinput determines how closely a past pattern must match the current pattern to be considered similar. A smallererrmeans the patterns must be more alike. Theglubinainput limits how far back the script searches in the historical database to avoid overworking and only focus on recent patterns. -
Prediction (Prognoz): If the script finds similar RSI patterns in the past, it averages the RSI values that followed those patterns. This average becomes the script's prediction (
Prognoz) for the future RSI value. Theprogninput shifts the prediction forward in time, indicating how many bars into the future the script is trying to predict. -
Averaging methods (calc_res, calc_res_exp): There are two methods the script utilizes for averaging the historical RSI values. One is a simple average (
calc_res), and the other weighs more recent patterns that match the current pattern more (calc_res_exp). This weighted average uses exponential weighting.
In Simple Terms:
Imagine you're trying to predict the weather. You look back at previous days and find days where the temperature, humidity, and wind speed were similar to today. You then check what the weather was like on those past days and average those outcomes to predict what the weather will be like tomorrow. This script does the same thing, but with price movements (represented by RSI) instead of weather conditions.
Inputs/Parameters:
start: The date from which to start analyzing the historical data.period: The time period used to calculate the custom RSI.pr_period: The length of the RSI pattern the script looks for.progn: How many periods into the future the script is trying to predict.err: The maximum acceptable difference between patterns for them to be considered similar.glubina: The maximum number of past patterns to consider when searching for similar ones.exp: A flag indicating which averaging method to use (exponential weighted if true, simple average if false).
Output:
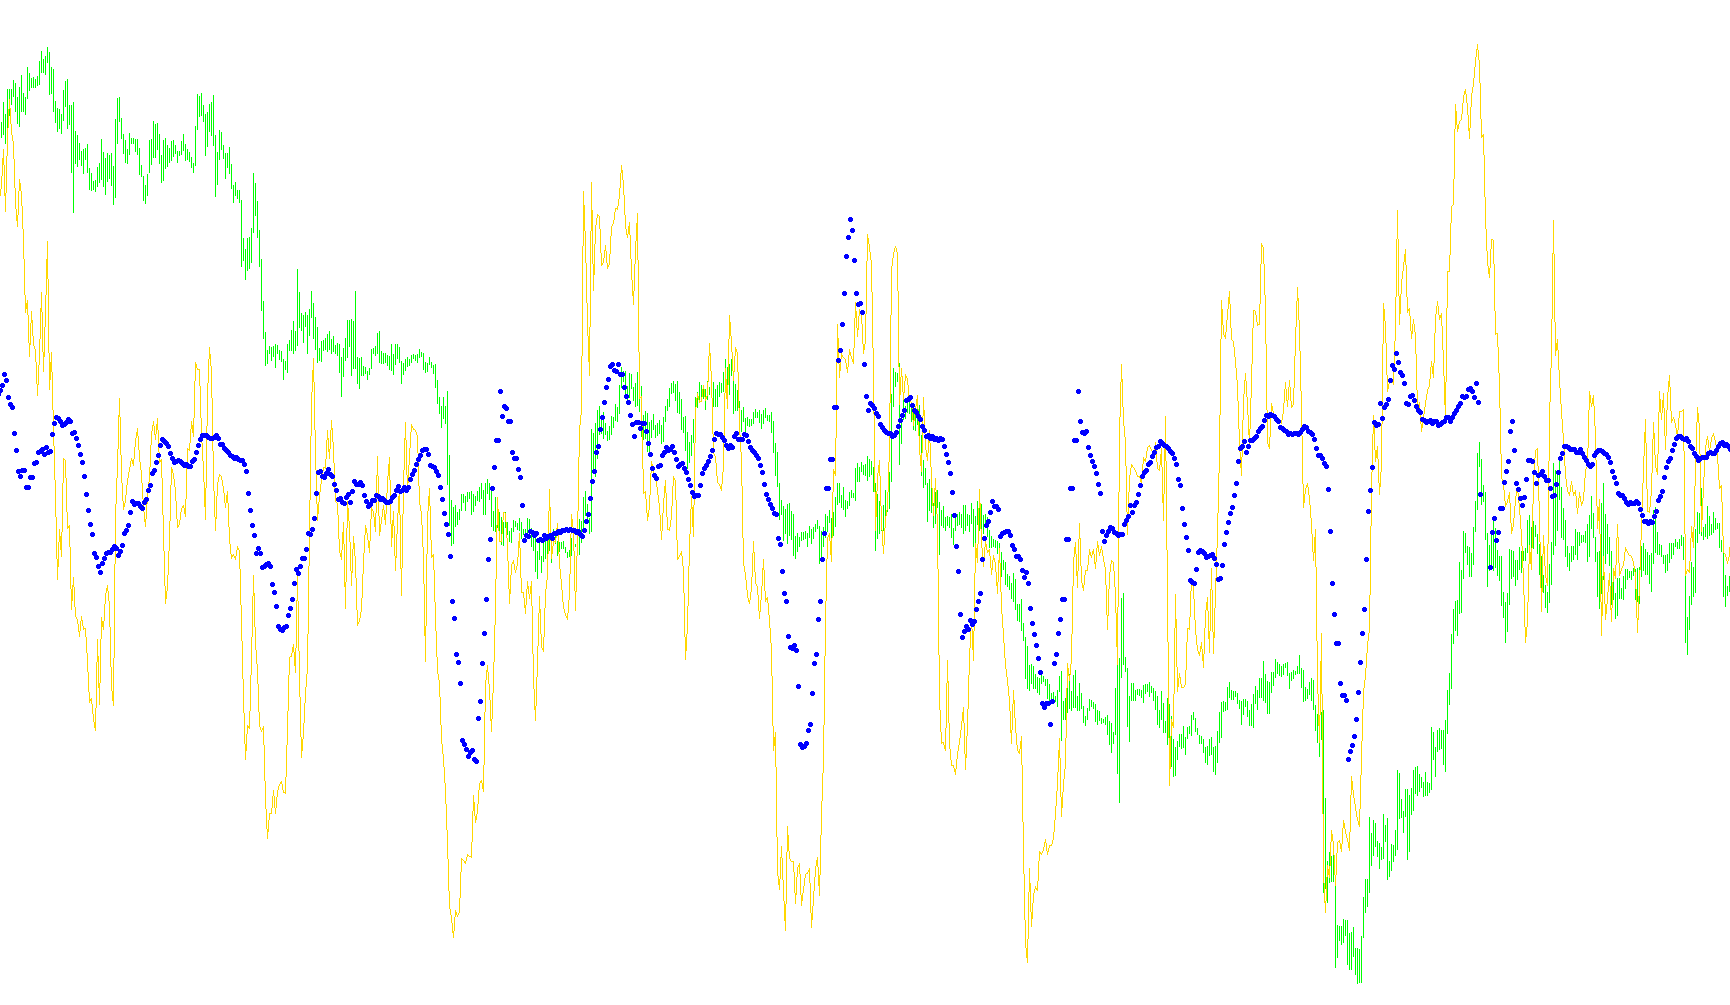
The script displays two lines on the chart:
Real: The calculated modified RSI values.Prognoz: The script's predicted RSI values, shifted forward in time (progn).
In essence, it's an attempt to forecast the future based on the repetition of past price patterns as described by the RSI indicator.
//+------------------------------------------------------------------+
//|                                                 !Rsi prognoz.mq4 |
//|                                                       Lizhniyk E |
//|                                        http://www.metaquotes.net |
//+------------------------------------------------------------------+
#property copyright "Lizhniyk E"
#property link      "http://www.metaquotes.net"

#property indicator_separate_window
#property indicator_buffers 2
#property indicator_color1 Red
#property indicator_color2 Blue
#property indicator_minimum 0
#property indicator_maximum 100

//---- input parameters
extern datetime  start=D'2008.10.01';
extern int       period=24;
extern int       pr_period=24;
extern int       progn=3;
extern double    err=10;
extern int       glubina=500;
extern bool      exp=false;
//extern bool      std_err=false;

//---- buffers
double Real[];
double Prognoz[];
//+------------------------------------------------------------------+
//| Custom indicator initialization function                         |
//+------------------------------------------------------------------+
int st, handle;
double dat[100000][100];
int dat_cnt=0;
double res_mas[1000];
int init()
  {
//---- indicators
   if(pr_period>98) pr_period=98;
   SetIndexStyle(0,DRAW_LINE);
   SetIndexBuffer(0,Real);
   SetIndexStyle(1,DRAW_ARROW);
   SetIndexArrow(1,159);
   SetIndexBuffer(1,Prognoz);
   SetIndexLabel(0,"Real");
   SetIndexLabel(1,"Prognoz");
   SetIndexShift(1,progn);

  // handle=FileOpen(Symbol()+" RSI pattern.csv",FILE_CSV|FILE_WRITE);

//----
   return(0);
  }
//+------------------------------------------------------------------+
//| Custom indicator deinitialization function                       |
//+------------------------------------------------------------------+
int deinit()
  {
//----
//----
   return(0);
  }
//+------------------------------------------------------------------+
//| Custom indicator iteration function                              |
//+------------------------------------------------------------------+
double res=0;
int res_cnt=0;
int start()
  {
   int    counted_bars=IndicatorCounted();
   int limit=Bars-counted_bars;
   if(counted_bars==0)
    {
    limit=iBarShift(NULL,0,start);
    }
//----

   int i,j,k;
   //***************
   for(i=limit;i>0;i--)
    {
    //***************
    double sump=0;
    double sumn=0;
    for(j=0;j<period;j++)
     {
     double r=(Close[i+j]-Close[i+j+1])/Point;
     if(r>0) sump+=r;
     else sumn-=r;
     }
    double sum=sump+sumn;
    if(sum==0) {Real[i]=0; continue;}
    Real[i]=(sump/sum)*100;
    //***************
    double stat=EMPTY_VALUE;
    //***
    for(j=0;j<pr_period;j++)
     {
     dat[dat_cnt][j]=Real[i+j+progn];
     }
    dat[dat_cnt][99]=Real[i];
    dat_cnt++;
    //***
    res=0; res_cnt=0;
    int g=dat_cnt;
    if(glubina>0 && dat_cnt>=glubina) g=glubina;
    for(k=g-1;k>=0;k--)
     {
     double nerr=0, nerr_cnt=0;
     for(j=0;j<pr_period;j++)
      {
      nerr+=MathAbs(dat[k][j]-Real[i+j]);
      nerr_cnt++;
      }
     nerr/=nerr_cnt;
     if(nerr<=err) {res_mas[res_cnt]=dat[k][99]; res_cnt++;}
     }
    if(res_cnt>0)
     {
     if(exp) stat=calc_res_exp(res_cnt);
     else stat=calc_res(res_cnt);
     }
    //***
    Prognoz[i]=stat;
    }
   //**************
   /*if(std_err)
    {
    double serr=0, secnt=0;
    for(i=limit-pr_period-progn;i>0;i--)
     {
     if(Prognoz[i+progn]!=EMPTY_VALUE)
      {
      serr+=MathAbs(Real[i]-Prognoz[i+progn]);
      secnt++;
      }
     }
    Alert("îøèáêà ïðîãíîçèðîâàíèÿ = ",serr/secnt);
    }*/

//----
   return(0);
  }
//+------------------------------------------------------------------+
double sigmoid(double val, double a)
{
double res=1.0/(1.0+MathExp(-1.0*a*(val-50.0)));
return (res*100);
}

double calc_res_exp(int cnt)
{
double val=2.0/cnt;
double inc=2.0;
double rr=0;
for(int i=0;i<cnt;i++)
 {
 rr+=res_mas[i]*inc;
 inc-=val;
 }
//if(sigm) return(sigmoid(rr/cnt,alpha));
return(rr/cnt);
}

double calc_res(int cnt)
{
double rr=0;
for(int i=0;i<cnt;i++)
 {
 rr+=res_mas[i];
 }
//if(sigm) return(sigmoid(rr/cnt,alpha));
return(rr/cnt);
}
Comments